
Use WGC 2025 and Q1 2026 data to track investment, central banks, jewelry, technology, real rates, currencies, risk, momentum, supply, and recycling.
- Investment and official-sector flows can move faster than mine supply, making gold a financial asset as well as a commodity.
- Full-year 2025 demand exceeded 5,000 tonnes including OTC; Q1 2026 then showed strong bars and coins, continued central-bank buying and weaker jewelry volumes.
- Use a dated dashboard of rates, currencies, risk, flows and physical demand—no single factor explains every month.

- Use dated demand data; the old “WGC 2024” framing is no longer current.
- Investment flows can move quickly, while mine supply responds slowly.
- Central banks remain important, but annual buying was below the prior three-year 1,000-tonne pace in 2025.
- High prices can reduce jewelry tonnage while lifting its value.
- Real yields, the dollar, risk and momentum can outweigh one quarterly tonnage line.
Updated through Q1 2026
This article replaces a static 2024 snapshot with a dated driver dashboard. The aim is not to reverse-engineer every price move from tonnage. It is to identify which demand channels are accelerating, which are price-sensitive, and which macro variables may be changing the willingness to hold gold.
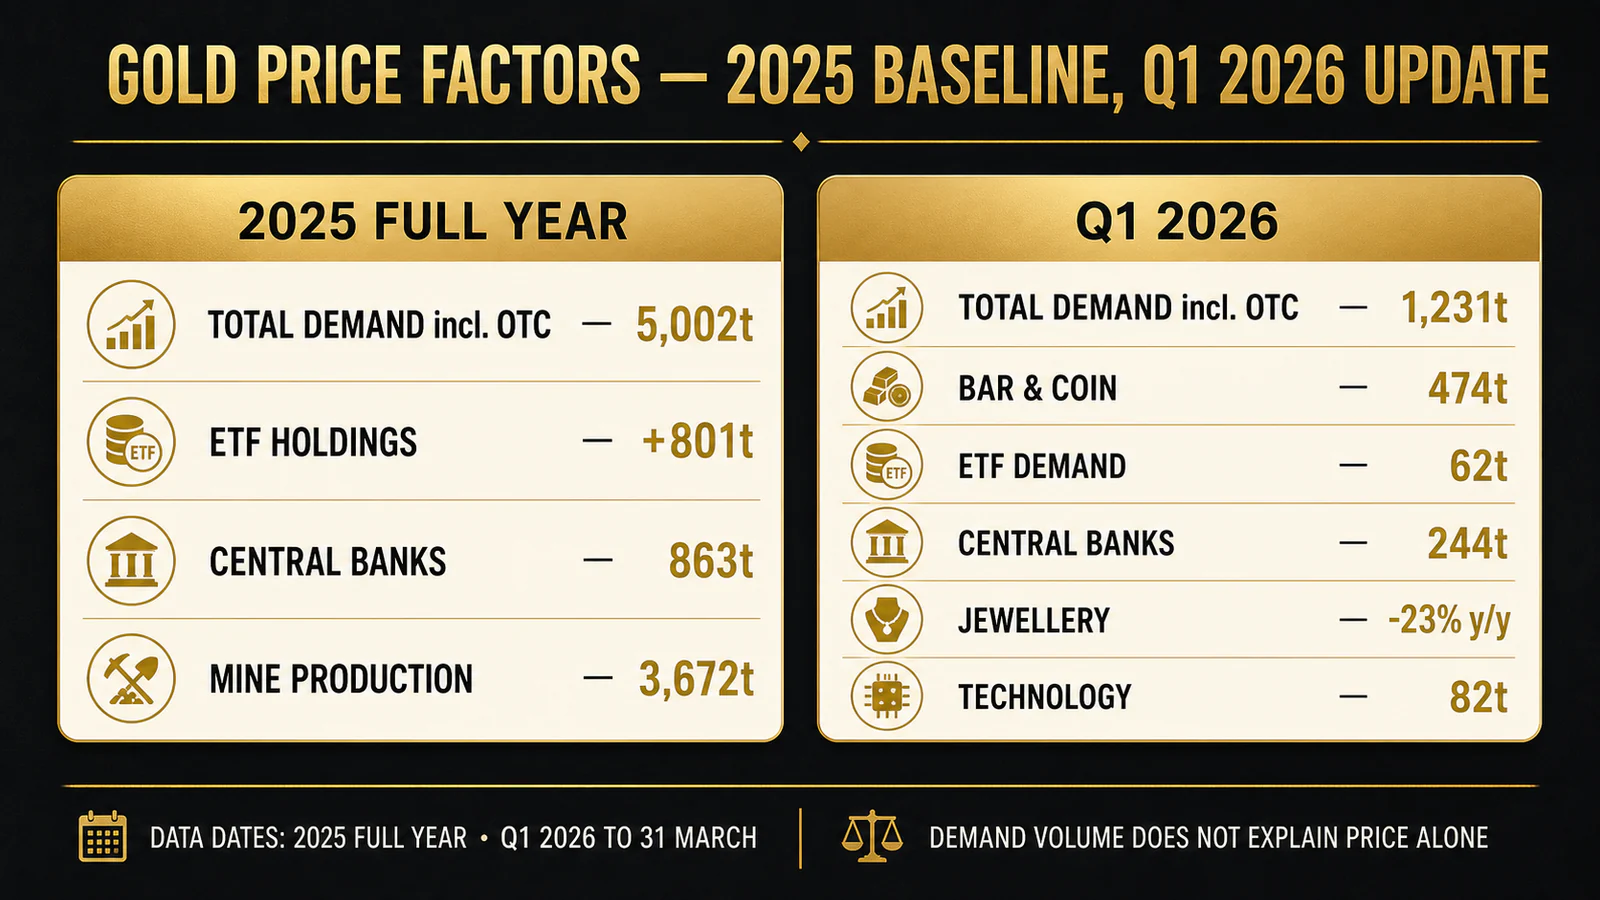
What the latest WGC data show
| Metric | 2025 full year | Q1 2026 | How to read it |
|---|---|---|---|
| Total demand incl. OTC | 5,002 t | 1,231 t | Broad demand remained historically large; quarterly data are not annualized forecasts. |
| ETF demand / holdings change | +801 t | +62 t | A fast investment-flow channel that can amplify price moves. |
| Bar and coin | 12-year high | 474 t, +42% y/y | Strong retail investment despite high prices. |
| Central banks | 863 t | 244 t, +3% y/y | Still substantial official demand, though disclosure and timing are imperfect. |
| Jewelry consumption | Volume -18% | Volume -23% y/y | Consumers bought fewer tonnes as prices rose; value can still increase. |
| Technology | Broadly stable | 82 t, +1% y/y | Small relative to investment but supported by electronics and AI-related demand. |
| Mine production | 3,672 t | Part of 1,231 t total supply | Supply changes slowly compared with investment flows. |
The full-year 2025 report and Q1 2026 report use WGC estimates, definitions and revisions. “Including OTC” adds estimated over-the-counter activity and stock flows; it is not a directly observed consumer category.
The four demand engines
1. ETFs, bars and coins
Investment demand reacts to expected real returns, currency concerns, volatility and price momentum. ETFs can add or release hundreds of tonnes through liquid financial markets. Bars and coins reflect household and wealth demand but include regional premiums, taxes and product constraints. A rally supported by both channels has a broader base than a move driven by futures positioning alone.
2. Central banks
Official institutions buy gold for reserve diversification, liquidity, long-horizon confidence and reduced dependence on another issuer’s credit. Central-bank demand can be less sensitive to short-term retail prices, yet reported purchases are incomplete and sometimes revised. Do not convert one annual total into a guaranteed monthly bid.
3. Jewelry
Jewelry is both adornment and savings in many markets. When prices rise sharply, buyers reduce weight, choose lower karat, recycle old pieces or postpone purchases. That means jewelry tonnage can fall during a strong gold market. Lower volume is not automatically bearish if investment demand is setting the marginal price.
4. Technology
Electronics uses gold in small, high-reliability applications. The WGC reported stable 2025 technology demand and modest Q1 2026 growth. It matters structurally but is too small to explain most large price moves alone. Read more in gold in electronics and gold in electric vehicles.
Why real yields matter
Gold does not pay a coupon. When inflation-adjusted yields on high-quality bonds rise, holding gold can become more expensive in opportunity-cost terms. When real yields fall—or confidence in the real return weakens—gold can become more attractive. The relationship is powerful but not mechanical: risk, central-bank demand and momentum can support gold even during periods of rising yields.
Use market-based inflation expectations cautiously. They contain liquidity and risk premia and are not the public’s single true inflation forecast.
The U.S. dollar and multi-currency confirmation
Gold is internationally quoted in dollars, so a weaker dollar often makes it cheaper for non-dollar buyers and supports the dollar gold price. During severe stress, however, both dollar and gold can rise as investors seek liquidity and safety. Check gold in euros, pounds, yen or local currency to see whether the move is global or largely foreign-exchange translation.
Risk and uncertainty change the price of liquidity
Financial instability, war, sanctions, debt concerns or policy uncertainty can increase demand for assets without another entity’s payment promise. Gold’s market is large and global, but “safe haven” does not mean stable every day. Investors may sell gold to meet margin calls, and a crisis premium can fade quickly.
Supply: slow, recycled and price-responsive
Mine projects take years to permit, finance and build. Higher prices can improve margins and eventually support exploration, but grades, costs and jurisdiction limit rapid response. Recycling reacts faster: households and businesses sell more material when price and economic need justify it. In 2025, mine production reached about 3,672 tonnes and recycling about 1,404 tonnes, while total supply grew only modestly.
Supply is essential for balance, but gold differs from a consumed commodity because most metal ever mined still exists above ground. The question is not only how much exists, but what price persuades current holders to sell.
A practical driver dashboard
- Gold return in dollars and major local currencies.
- Nominal and real yields across the relevant maturity.
- Broad dollar direction, not only one currency pair.
- Global physically backed ETF inflows or outflows.
- Bar-and-coin demand and regional premiums.
- Disclosed central-bank net purchases.
- Futures positioning, options skew and volatility.
- Jewelry volumes, recycling and mine guidance.
- Upcoming central-bank, inflation and employment events.
Worked scenario: why the same data can produce different prices
Quarter A has 250 tonnes of central-bank buying, but ETF investors sell 100 tonnes, real yields rise and the dollar strengthens. Quarter B has 200 tonnes of central-bank buying, ETF investors add 150 tonnes, real yields fall and the dollar weakens. The smaller official-sector number in Quarter B can coexist with a stronger price because fast financial demand and opportunity cost changed.
This is a mechanism example, not a forecast.
What the 2026 outlook does—and does not—say
The WGC’s mid-year 2026 outlook discusses the interaction of macro conditions, risk and momentum. Scenario work is useful because it links drivers to outcomes. It should not be read as a target guarantee. Markets can price expected policy long before official data confirm it.
For adjacent context, compare why gold is going up, gold price history, gold price outlook, gold technical analysis and gold as a safe haven during recession.
OTC and futures positioning: the less visible layer
Over-the-counter gold includes bilateral transactions among banks, institutions, refiners, producers and large clients. WGC estimates OTC and stock flows because no single exchange records the entire market. Futures data are more visible, but an increase in open interest can represent new longs, new shorts or hedging. Positioning should be combined with price, volume and participant categories rather than labeled bullish automatically.
Options can accelerate moves around popular strikes through dealer hedging. That effect is usually short-term and does not replace the fundamental balance, but it can explain why price moves faster than quarterly physical-demand data suggest.
Producer hedging and the mine-supply nuance
Mining companies sometimes sell future production forward or use options to protect cash flow. Net producer hedging can add supply to the market today; de-hedging can remove it. The effect is smaller than in some historical periods but belongs in a complete flow picture. A higher gold price can also raise costs, taxes and royalties, so mine margins do not expand one-for-one.
Reserve growth depends on exploration success and the economic cutoff grade. When price rises, lower-grade material may become economic, increasing reported reserves without a new geological discovery. Conversely, permitting and community constraints can prevent a technically viable resource from becoming supply.
Shanghai, Indian and Middle Eastern physical markets can trade at premiums or discounts to global references because of import rules, taxes, local demand, financing and logistics. A premium can attract imports and arbitrage until constraints ease. It is useful evidence of regional tightness, but it should not be added mechanically to a global price forecast.
How to avoid a one-factor narrative
Write a driver hypothesis with three columns: supporting evidence, conflicting evidence and the next event that could change the balance. If gold rises while the dollar and real yields also rise, do not discard the data; investigate whether official demand, risk or momentum is dominating. If ETFs flow in while price stalls, ask whether recycling, futures selling or a stronger currency is offsetting them.
Revisit the explanation after the observation window. A valid attribution should explain both direction and timing without changing definitions after the fact.
Demand tables measure flows, while the price clears a market of expectations and existing stocks. A tonne bought by a price-insensitive reserve manager is not economically identical to a tonne bought by a momentum fund. Direction, speed, motivation and available inventory all matter.
The best gold explanation is rarely “central banks” or “rates” alone. Use a hierarchy: identify the time window, find the fast financial driver, test it against slower physical demand and supply, then state what evidence would overturn the explanation.
This article is educational and not personalized investment advice. Gold can fall sharply, historical relationships can break, and WGC data are estimates that may be revised. Verify current data, prices, fees, taxes and product risks.
Video context This interview explains how the World Gold Council organizes demand data. Treat the discussion as dated market context and verify figures against the reports linked below.
Bottom Line
WGC 2025 and Q1 2026 data show strong investment and official demand alongside price-sensitive jewelry consumption and slow supply growth. Those flows explain the market’s structure, but the marginal price still depends on real yields, currencies, risk, positioning and momentum. Use a dated dashboard—not a one-factor story.
FAQ: Gold Price Factors
What is the biggest driver of gold prices?
It changes by horizon. Real yields, the dollar and financial flows often dominate short periods; reserve demand, supply and savings behavior shape longer regimes.
Did central banks keep buying gold in 2025?
Yes. WGC estimates 863 tonnes of net official-sector purchases in 2025, still substantial but below the prior three-year pace above 1,000 tonnes.
Why can jewelry demand fall while gold rises?
Higher prices reduce the quantity consumers can afford, while investment and official buyers may still bid the marginal price higher.
Does lower interest rates always make gold rise?
No. Gold responds to real yields, expectations, currencies and risk. If easing is already priced or the dollar strengthens, the reaction can differ.
Is WGC demand data the same as price causality?
No. It estimates market flows. Price also reflects expectations, above-ground stocks, positioning, liquidity and the timing of transactions.
Sources and verification
Primary and specialist sources are linked below. Rules, market data and product specifications can change; verify the dated source before acting.
- WGC — Gold Demand Trends FY 2025 — Full-year demand, price, investment, central bank and supply baseline.
- WGC — Gold Demand Trends Q1 2026 — Latest quarterly demand composition and price context.
- WGC — Q1 2026 Investment — Bars, coins, ETFs and liquidity-driven outflows.
- WGC — Q1 2026 Central Banks — Official purchases and sales.
- WGC — Q1 2026 Technology — Industrial demand and AI/EV electronics.
- WGC — FY 2025 Investment — Annual ETF, bar and coin demand.
- WGC — FY 2025 Jewelry — Volume versus value-spend distinction.
- WGC — Gold Return Attribution Model — Economic expansion, risk, opportunity cost and momentum.
- WGC — Mid-Year Outlook 2026 — Current scenarios and technical/macro interaction.
- WGC — Market Size and Structure — Gold liquidity and market channels.
 When you purchase a service or a product through our links, we sometimes earn a commission, at no extra cost to you.