Gold can rise with lower real yields, dollar weakness, ETF inflows, central-bank demand, and risk. Use five dated signals instead of one headline.
- Gold’s move depends on the time window: a long rally can still contain sharp corrections.
- Real yields, the U.S. dollar, ETF flows, central-bank demand and risk appetite are the five most useful signals.
- No single driver guarantees a higher price; compare several dated indicators before acting.
- Falling or less-attractive real yields often support gold by reducing its opportunity cost.
- A weaker dollar often helps, but the relationship can break during global stress.
- Central-bank demand can create a structural bid that is less price-sensitive than jewelry demand.
- ETF flows and futures positioning can accelerate both rallies and selloffs.
- Always define the date window: “up today,” “this year” and “since 2020” can have different explanations.
Start with the time window, then test the drivers
“Why is gold going up?” sounds like one question, but it contains at least three. Is the move intraday, over several months or over a multiyear cycle? Is gold rising only in U.S. dollars or also in euros, yen and other currencies? Is the move driven by fundamentals, positioning, or both?
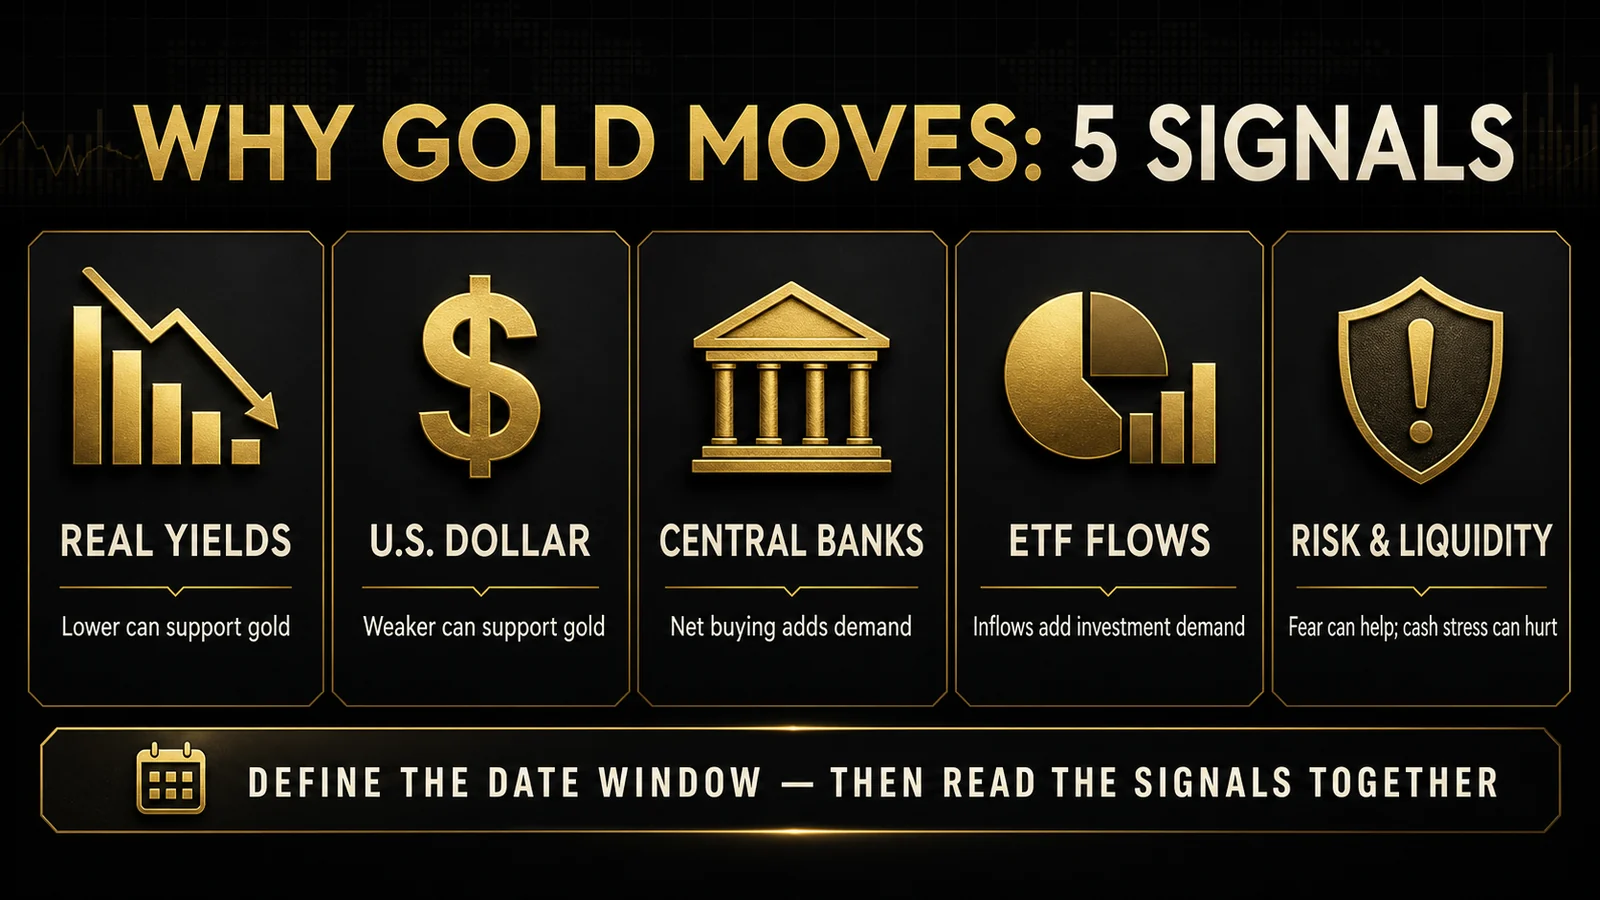
The five-driver framework
| Driver | Gold-supportive pattern | What can contradict it |
|---|---|---|
| Real yields | Inflation-adjusted bond yields fall or become less attractive. | Gold can rise with yields when risk or official demand dominates. |
| U.S. dollar | The broad dollar weakens, making dollar gold cheaper in other currencies. | Dollar and gold can rise together in a flight to liquidity. |
| Central banks | Persistent official-sector purchases add demand and diversify reserves. | Buying is uneven and reported with lags. |
| Investor flows | ETF inflows and futures buying amplify demand. | Crowded positioning can unwind quickly. |
| Risk and liquidity | War, policy uncertainty, fiscal concern or banking stress increases hedging demand. | Initial cash scrambles can force gold selling before safe-haven buying returns. |
1. Real yields and the opportunity cost of gold
Gold pays no coupon. When safe inflation-protected yields rise, investors receive more compensation for holding government bonds instead. When real yields fall, gold’s lack of income becomes less costly. The Federal Reserve Bank of St. Louis 10-year TIPS series is a useful public proxy, though it is not the only maturity or real-rate expectation in the market.
The relationship is powerful but not mechanical. A rise in real yields may reflect tighter policy, stronger growth or changing inflation expectations; each can affect gold differently. Compare direction and speed, not a single level.
2. The dollar and currency translation
International gold is commonly quoted in U.S. dollars. A weaker dollar can lift the dollar gold price because buyers using other currencies need fewer local-currency units for the same ounce. The Fed’s broad trade-weighted dollar index is more informative than comparing only one currency pair.
Check local-currency performance too. Gold can set a record in one currency while moving less dramatically in another. This distinction matters for anyone reading a U.S.-centric headline from outside the United States.
3. Central-bank demand
Central banks hold gold as a reserve asset without another issuer’s credit promise. Purchases can reflect diversification, sanctions risk, currency confidence, reserve growth or long-term policy. The World Gold Council’s Q1 2026 central-bank analysis provides current demand context, but reported totals combine official data and estimates and can be revised.
Official buying is important because it may be less sensitive to short-term retail affordability. It is not a guarantee of a straight-line price: central banks can slow purchases, sell, or choose different reserve assets.
4. ETF flows, futures and positioning
Physically backed ETF inflows require the market structure to source additional exposure, while outflows release it. Futures traders can change exposure faster and with leverage. These flows often explain why gold moves more sharply than slow-moving supply and demand data alone would imply.
For the mechanism, see how gold ETFs work. Holdings data are more useful than viral claims about “paper gold” because they provide a dated measure with defined coverage.
5. Geopolitical, fiscal and financial risk
Gold can benefit when investors question the durability of currencies, sovereign debt, banking systems or geopolitical arrangements. It is portable across borders and has no corporate earnings stream to impair. Yet “fear” is too vague to be a complete explanation: identify the event, the transmission channel and the assets investors are leaving.
The BIS March 2026 Quarterly Review offers a current institutional view of market conditions. Gold may also be sold temporarily when leveraged investors need cash, so a risk event can produce a two-stage move.
Why mine supply does not set the daily price
New mine output changes slowly because exploration, permitting and construction take years. Gold also has an unusually large above-ground stock: much of the metal ever mined still exists as jewelry, bars, coins and official reserves. Daily price is therefore set at the margin by changing willingness to hold or release existing stocks, not simply by today’s mine production.
Recycling responds more quickly to price and local economic conditions. Jewelry demand can weaken when prices rise, providing a partial stabilizer. The market clears across investment, central-bank, jewelry, technology and recycling flows.
Suppose gold rises 8% in a month, the broad dollar falls 2%, real yields decline 0.25 percentage points, physically backed ETFs report inflows and a geopolitical shock occurs. The evidence supports a multi-driver explanation. It does not prove that the geopolitical headline alone caused 8%, nor that another 8% must follow.
A practical weekly dashboard
- Gold’s change over one day, one month and one year.
- Gold in both U.S. dollars and your home currency.
- 10-year real yield direction, not just the latest print.
- Broad dollar direction.
- Physically backed ETF holdings and flows.
- Central-bank demand in the latest quarterly report, with reporting lag noted.
- The specific risk event and the asset-market response.
Use live gold prices for a timestamp, gold price history for context, and gold price factors for the longer causal framework. A gold price outlook should be read as scenarios, not certainty.
What could make gold fall?
A durable rise in real yields, a stronger dollar, ETF outflows, easing risk, weaker official purchases or profit-taking can pressure gold. Several can arrive at once. High prices can also reduce jewelry demand and encourage recycling. None produces a fixed price target.
Nominal records are not the same as purchasing-power records
A nominal record compares the current quote with past dollar quotes. An inflation-adjusted comparison asks what those past dollars could buy. A local-currency comparison adds exchange-rate effects. Headlines often switch among these frames without saying so, making the move look more universal than it is.
For household decisions, the relevant benchmark may be a local stock index, short-term government yield, inflation or the price of the asset the household plans to buy. Gold can reach a dollar record and still underperform another asset over the same period. “Up” should always be followed by “relative to what?”
Feedback loops can extend—and reverse—a rally
Higher prices attract media attention and momentum flows. ETF inflows can create additional buying, while option hedging and futures positioning can accelerate moves. Rising prices may also encourage recycling and deter price-sensitive jewelry purchases, which works in the opposite direction.
These feedback loops explain why the price can overshoot a slow-moving fundamental estimate. They also explain abrupt corrections when positioning becomes crowded. The catalyst that begins a trend is not always the flow that carries its final stage.
| Observation | Stronger inference | Weak inference to avoid |
|---|---|---|
| Gold up, real yields down, dollar down | Opportunity cost and currency channels are aligned. | Rates alone set the exact price. |
| Gold and dollar both up during a shock | Safe-haven and liquidity demand may coexist. | The usual inverse relationship no longer matters forever. |
| Gold up with heavy ETF inflows | Investor demand is amplifying the move. | ETF flows prove future gains. |
| Gold up while jewelry demand weakens | Investment or official demand may be dominating. | Every demand category is rising. |
Most explanations are written after the move and select the headline that fits. A stronger test records the proposed drivers before the next observation, uses consistent data and accepts periods when the relationship fails. Correlation over one episode is not a permanent law.
The best answer in July 2026 is not “gold is up because of uncertainty.” It is a dated dashboard showing which channels are active and where the evidence is mixed. That approach remains useful after today’s narrative changes.
This is market education, not a prediction or personalized investment advice. Gold is volatile, produces no cash flow and can experience deep drawdowns even within a long-term uptrend.
Watch the mechanism: This market explainer adds a visual perspective on the macro drivers behind gold moves.
Bottom Line
Gold tends to rise when real yields, currency conditions, official demand, investor flows and perceived risk make it more attractive relative to alternatives. Define the period, test all five drivers and separate a plausible explanation from a forecast.
FAQ: Why Gold Is Going Up
Why does gold rise when interest rates fall?
Lower rates—especially lower real yields—reduce the income investors give up by holding non-yielding gold. The relationship is influential but not automatic.
Does inflation always make gold go up?
No. Inflation can support gold, but central-bank responses, real yields, the dollar and positioning can dominate over shorter periods.
Why can gold and the dollar rise together?
During global stress, investors may seek both dollar liquidity and gold as reserve or hedge assets. Relationships can change by episode.
Are central banks causing the gold rally?
Central-bank buying can be an important structural driver, but price also reflects investment flows, rates, currencies, jewelry, recycling and risk.
Is it too late to buy gold after it rises?
No universal answer exists. Decide from your objective, target allocation, horizon, total costs and loss tolerance rather than recent momentum alone.
Sources and verification
This guide relies on regulator, issuer, mint and specialist market sources. Product terms, prices and regulations can change, so recheck the dated primary source before acting.
- World Gold Council — Gold Market Commentary, May 2026 — Current analysis of dollar, yields, ETF flows and demand channels.
- World Gold Council — Gold Demand Trends Q1 2026: Investment — Quarterly investment demand, ETF activity and market corrections.
- World Gold Council — Q1 2026 Central Banks — Current disclosed and estimated official-sector buying and selling context.
- World Gold Council — Gold Outlook 2026 — Scenario framework for rates, currency, growth and geopolitical risk.
- BIS Quarterly Review, March 2026 — Central-bank perspective on 2026 precious-metal volatility, ETF premia and retail flows.
- FRED — 10-Year Treasury Inflation-Indexed Security — Daily U.S. 10-year real-yield series for testing opportunity-cost narratives.
- Federal Reserve — Broad Dollar Index — Daily trade-weighted U.S. dollar measure.
- LBMA — Precious Metal Prices — Benchmark price context; any live level must be time-stamped.
- World Bank — Precious Metals Retreat from Record Highs — Independent current discussion of gold, platinum, demand and macro risks.
- Bloomberg Originals — What Gold’s Rise Really Means — Current visual context for interpreting a gold rally without relying on a price prediction.
 When you purchase a service or a product through our links, we sometimes earn a commission, at no extra cost to you.