

Read a dated H2 2026 gold price outlook with bull, base, and bear scenarios tied to rates, the dollar, risk, flows, and demand.
- As of July 17, 2026, gold’s first-half surge and correction make ranges and triggers more credible than one precise target.
- The main H2 drivers are real yields, the U.S. dollar, geopolitical risk, investor flows, and central-bank demand.
- Use bull, base, and bear conditions to plan entries, rebalancing, and invalidation points—never a guaranteed forecast.
- Gold’s H1 2026 path included a record surge and a sharp correction, so volatility belongs in the outlook.
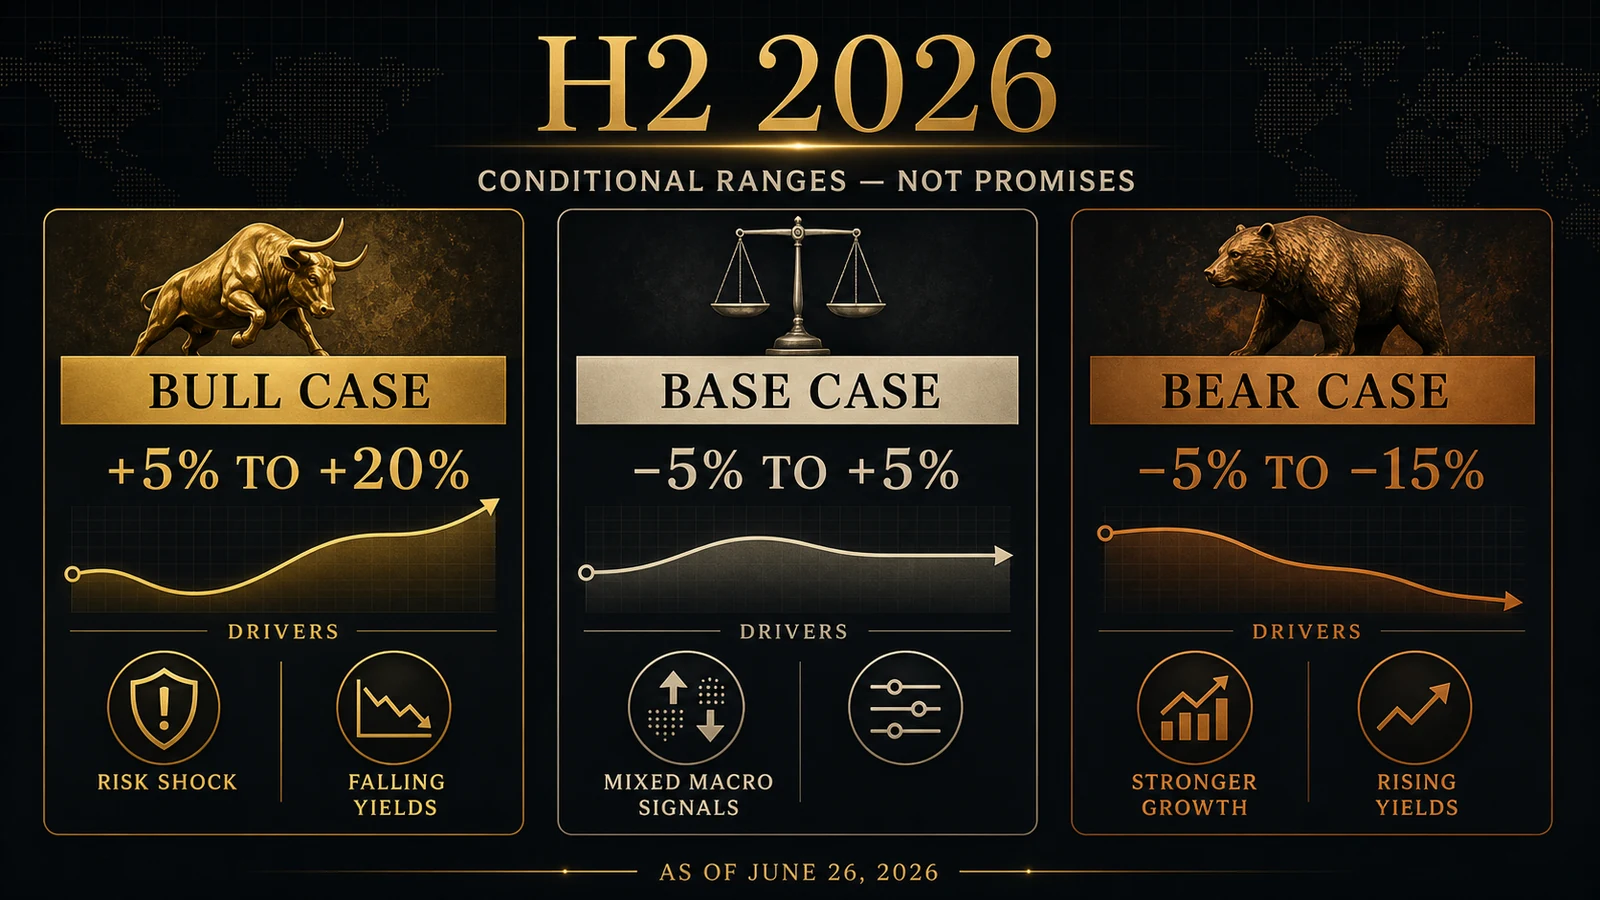
- World Gold Council H2 scenarios use approximately +5% to +20%, −5% to +5%, and −5% to −15% ranges from a late-June reference.
- Real yields, the dollar, risk, investor flows, and central-bank demand are the core drivers.
- Structural support can coexist with a short-term drawdown.
- Choose position rules and vehicle before acting on a forecast.
Dated July 17, 2026
The World Gold Council’s July 1 mid-year outlook says gold was down about 7% year to date by June 26 after setting 12 all-time highs and exceeding $5,500 intraday in January. That wide path makes a single year-end target less useful than conditions that would validate or invalidate a scenario.
The H2 2026 scenario map
WGC’s ranges are hypothetical outcomes from its macro framework, not price forecasts. The reference point is the average LBMA Gold Price for the week ending June 26, 2026.
| Scenario | Illustrative H2 range | Conditions that support it | What would weaken it |
|---|---|---|---|
| Bull / uptrend | +5% to +20% | Worsening economy or risk, lower rate expectations, renewed long-term and dip-buying flows | Risk calms, yields rise, dollar strengthens, flows fail to confirm |
| Base / macro consensus | −5% to +5% | Moderate growth, cooling but elevated inflation, limited policy change, balanced flows | A clear macro or geopolitical break |
| Bear / consolidation | −5% to −15% | Resilient growth, rising yields, calmer markets, profit-taking | Bargain demand, central-bank buying, or renewed stress absorbs selling |
Apply the percentages to a dated reference, not today’s live quote. A range can shift as the reference point and macro assumptions change.
Range, probability, and target are not the same
A scenario range describes a plausible outcome if its conditions occur. It does not say how likely that scenario is, and its midpoint is not automatically a price target.
Before using any forecast, ask for three separate fields: the reference price and date, the conditional return range, and the analyst’s probability or confidence. If one is missing, do not silently infer it from the others.
Driver 1: real yields and opportunity cost
Gold pays no coupon. When inflation-adjusted yields on high-quality bonds rise, holding gold becomes more expensive in opportunity-cost terms; falling real yields often help.
The relationship is not mechanical. Risk shocks, currency changes, central-bank demand, and momentum can overwhelm rates over shorter windows.
Driver 2: the U.S. dollar
Gold is globally traded and commonly quoted in U.S. dollars. A stronger broad dollar can make gold more expensive in other currencies and pressure dollar gold, while a weaker dollar can support it.
Local-currency outcomes differ. A European or emerging-market buyer should track both XAU/USD and the exchange rate that determines the local purchase price.
Driver 3: risk and uncertainty
Geopolitical conflict, financial stress, and recession fear can create safe-haven demand. The WGC attributes a meaningful portion of H1 variability to risk, foreign exchange, and momentum.
Gold can also fall during stress when investors raise cash or unwind leveraged positions. “Safe haven” describes a tendency under some conditions, not immunity from drawdowns.
Driver 4: investor flows and momentum
ETF holdings, futures positioning, options, and bar-and-coin demand can amplify a trend. A price breakout supported by broad, persistent flows is different from a brief event spike.
Flow data have timing and coverage limits. Confirm changes across several weeks and distinguish new allocation from short covering.
Driver 5: central-bank demand
Official-sector buying can support long-term demand and diversification narratives. Reporting is delayed, revised, and sometimes incomplete, so it is a structural input rather than a precise weekly timing tool.
Compare WGC estimates, IMF-reported reserves, and country disclosures where available. Do not turn a quarterly tonnage estimate into a guaranteed floor.
How the 2026 outlook can fail
Forecasts fail when assumptions change faster than the model or analyst. A surprise inflation path can raise both risk demand and yields, producing conflicting effects.
Policy changes, capital controls, sanctions, market plumbing, large option positions, or a sudden need for liquidity can create nonlinear moves. The widest risk is not “wrong target” but using a target without an invalidation rule.
Worked example: turn a view into rules
An investor intends to hold a strategic allocation rather than trade a year-end number. Instead of buying the full amount after one bullish headline, the investor divides the decision into an initial tranche, a scheduled review, and a rebalance band.
The investor records the vehicle, premium or expense ratio, tax treatment, maximum allocation, and conditions that would pause further buying. If yields and the dollar rise while flows weaken, the plan does not automatically chase price.
| Vehicle | Useful for | Main tracking gap or risk |
|---|---|---|
| Physical bullion | Direct ownership and long-horizon custody | Premium, spread, storage, insurance, and slower sale |
| Physically backed ETF/ETP | Liquid market exposure and rebalancing | Fee, structure, custody, market price versus NAV |
| Futures | Professional hedging and price exposure | Leverage, roll, margin, and liquidation risk |
| Mining shares | Operational leverage to gold and company growth | Costs, geology, management, equity market, country risk |
A correct macro view can still produce a poor personal outcome if the vehicle is too expensive or leveraged. Review spot price versus retail price and how gold ETFs work.
A 90-day review routine
- Write the as-of date, reference price, horizon, and current scenario.
- Review real yields, the broad dollar, risk conditions, ETF flows, and official demand on a fixed schedule.
- Record which indicators confirm, conflict with, or invalidate the scenario.
- Compare the chosen vehicle’s actual return with spot after fees and spreads.
- Rebalance by policy rather than by social-media urgency.
- Refresh the scenario after a major policy, inflation, growth, or geopolitical shock.
For deeper driver analysis, use gold price factors, gold technical analysis, AI gold forecasting limits, why gold rises, and gold price history.
Most outlook pages publish a target but not the reference price, scenario probability, invalidation rule, expected drawdown, or implementation cost. Without those fields, readers cannot distinguish analysis from a promotional number.
The useful forecast is the one that changes a decision rule. If you cannot state what evidence would move you from bull to base or bear—and how the position would change—the target is entertainment, not a plan.
This dated outlook is educational scenario analysis, not personalized investment advice or a guaranteed forecast. Markets can move outside historical or modeled ranges, and losses are possible.
Watch: Gold Prices: Goldman Sachs Sees Precious Metal Rising Almost 20% in 2026
This Bloomberg segment shows how an institutional target is framed. Compare its assumptions and date with the conditional WGC ranges rather than treating one number as certainty.
Video: Bloomberg Television. YouTube oEmbed availability validated July 17, 2026.
Bottom Line
The H2 2026 gold outlook is balanced around a volatile starting point. Rangebound conditions remain plausible, upside needs renewed macro or risk catalysts, and downside needs resilient growth, higher yields, calmer markets, and weaker flows; plan with triggers, ranges, and costs.
FAQ: Gold Price Outlook 2026
Is the gold price outlook bullish for the rest of 2026?
It is conditional. Structural demand can support gold, but H2 performance depends on yields, the dollar, risk, flows, and growth.
What is the base-case range for H2 2026?
The World Gold Council’s July 2026 hypothetical macro-consensus range was approximately −5% to +5% from its late-June reference, not from any future live price.
Could gold fall despite central-bank buying?
Yes. Rising yields, a stronger dollar, profit-taking, or weaker investment flows can outweigh structural official demand over shorter periods.
Which indicator matters most for gold?
No single indicator always dominates. Real yields, the dollar, risk, momentum, and demand interact and can conflict.
How often should I update a gold outlook?
Use a fixed monthly or quarterly review and refresh after a major policy, inflation, growth, financial-stress, or geopolitical change.
Sources and verification
Use the primary documents below to verify rules, data, definitions, and evidence. Product terms, market conditions, and research conclusions can change.
- World Gold Council — Gold Mid-Year Outlook 2026
- World Gold Council — Gold Outlook 2026
- World Gold Council — Gold Demand Trends Q1 2026 outlook
- LBMA — 2026 analysts forecasts
- Federal Reserve — June 2026 economic projections
- FRED — 10-year real interest rate
- FRED — Broad trade-weighted U.S. dollar index
- IMF — World Economic Outlook database
- World Gold Council — Gold ETF flows
- World Gold Council — Central bank gold reserves survey 2026
 When you purchase a service or a product through our links, we sometimes earn a commission, at no extra cost to you.