

Investigate a gold rally with a dated evidence sheet, counter-signals, a real market example and a worked comparison of dollar and euro returns.
- Define the dates, currency and quote behind a claimed rally.
- Compare evidence and counter-signals before assigning a cause.
- Separate a past price rise from a forecast or buying decision.

“Gold is going up” can mean a gain today, a rebound after a selloff or a multiyear advance. Those are different events, and the explanation can change when you move the starting date.
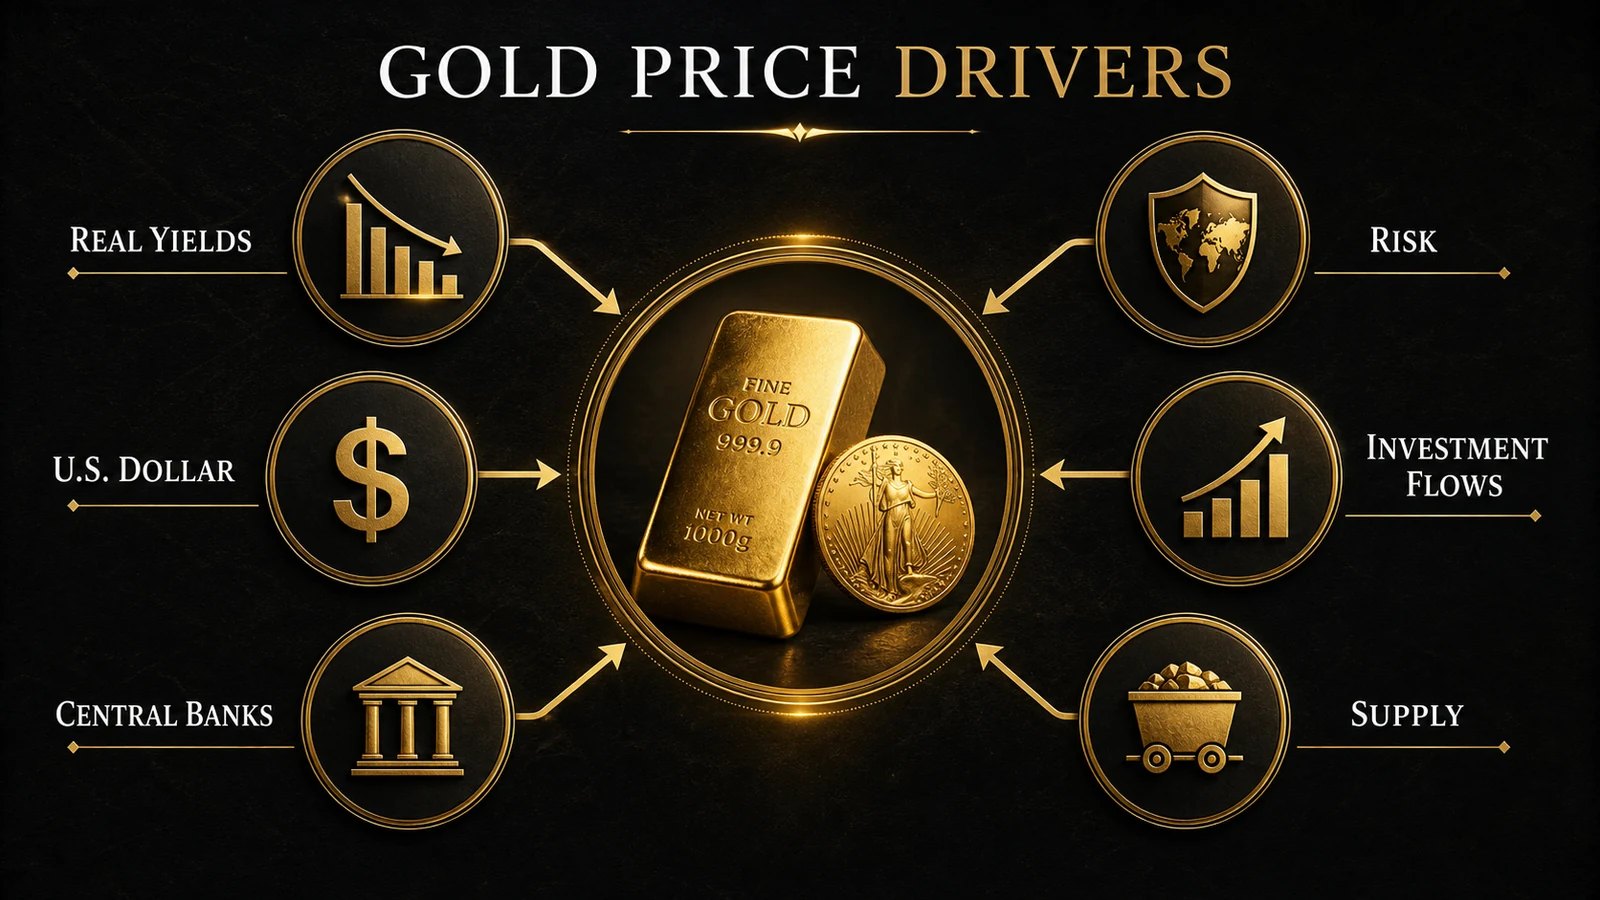
Use the following steps to investigate a rally rather than choosing the most dramatic headline. For the mechanics of rates, demand and supply in both directions, start with the gold price factors guide.
- Write down the starting price, ending price, dates and currency.
- Separate observations from proposed causes.
- Match rates, currencies and flows to the same period.
- Check reporting lags and evidence that points the other way.
1. Define the move before looking for a cause
Choose one price series and keep it consistent. Mixing an intraday spot high with a benchmark closing value can create a return that does not describe either series properly.
| Question | Record this | Common mistake |
|---|---|---|
| Up over what period? | Exact start and end dates, with times where relevant. | Describing a monthly rebound as a new long-term record. |
| Up in which currency? | USD and, if relevant, your home currency. | Assuming the dollar return is everyone’s return. |
| Which quote? | The same provider and price convention. | Comparing a dealer ask with yesterday’s wholesale bid. |
| Up relative to what? | The previous observation, inflation or another asset. | Calling a nominal gain a purchasing-power gain. |
The return formula is (ending price ÷ starting price − 1) × 100. For example, 4,000 to 4,200 in the same currency is a 5% rise; these are hypothetical prices, not current quotes.
Use timestamped gold prices for the current quote and price history for your comparison period. A chart’s vertical scale can make the same percentage change look much larger or smaller.
2. Build an evidence sheet for the same dates
Start with observations you can verify, then add the interpretation. “The real yield declined” is an observation; “that decline contributed to the rally” is a hypothesis.
| Signal and source | What to record | Timing or interpretation limit |
|---|---|---|
| 10-year real yield | Start, end and change in percentage points. | Not the policy rate; no fixed conversion into a gold return. |
| Broad US dollar index | Direction over the same window. | Not interchangeable with your individual exchange rate. |
| WGC market commentary | Reported ETF and positioning evidence, with dates. | Monthly context cannot by itself explain every intraday move. |
| WGC quarterly demand tables | Category, period, units and revision status. | Published later; includes estimates that can change. |
| The claimed news catalyst | Publication time and the proposed transmission channel. | A headline appearing after the move cannot establish its initial trigger. |
Keep blank cells when evidence is unavailable. Filling them with an assumption makes a tidy dashboard less reliable, and several entries may reflect the same underlying event rather than independent confirmation.
3. Test the explanation against competing evidence
If the story is “lower rates”
Ask whether real yields actually fell during the rally. A central-bank decision may already have been expected, while a small change in guidance can produce a larger reaction than the decision itself.
The WGC’s discussion of past rate hikes describes episodes with different gold responses. The surprise relative to expectations matters more than labeling every cut bullish and every hike bearish.
If the story is “a weaker dollar”
Check the broad dollar and the particular currency relevant to the reader. Then compare gold returns in both currencies to see how much of the apparent gain is translation.
Gold and the dollar rising together does not invalidate arithmetic. It means a simple inverse-dollar narrative is incomplete for that episode.
If the story is “safe-haven demand”
Name the risk and the route by which it could affect holdings: portfolio hedging, reserve preferences or a change in confidence, for example. “Uncertainty” without a date or channel is too broad to test.
Also look for selling caused by cash needs or reduced leverage. A crisis can change both the desire to own gold and the ability to keep positions open.
If the story is “central banks bought”
Check when the purchases occurred, when the data were released and whether the number was revised. A quarterly estimate cannot establish who bought during a particular trading session.
For the structural rationale, see central-bank reserve demand. Keep that long-term context separate from evidence about the immediate catalyst.
If the story is “ETF money is flowing in”
Distinguish a change in holdings from a rise in the dollar value of unchanged holdings. Assets under management can increase simply because the gold already owned became more expensive.
The WGC’s investment-demand reporting separates bar-and-coin activity and ETF demand. Do not add those categories to a broader investment total that already includes them.
A dated case: gold rose despite opposing signals
In its report published 21 September, the WGC noted that gold advanced while bond yields edged higher and the dollar strengthened. ETF flows were positive across regions, and gains occurred mainly during Asian trading hours.
The report itself cautioned that the true drivers were difficult to isolate. Read the dated Weekly Markets Monitor; this is a historical example, not a live assessment of today’s session.
Positive ETF flows accompanied the gold advance.
Higher bond yields and a stronger dollar did not prevent the rise.
The exact causal share of each participant or channel.
A careful explanation preserves that contradiction. It does not rewrite the evidence to make all indicators point in the same direction.
4. Check whether the rally survives a currency comparison
A home-currency return can differ sharply from the headline dollar return. Use the exchange rate convention explicitly: in the following example, EUR/USD means dollars per euro.
| Measure | Start | End | Change |
|---|---|---|---|
| Gold, USD/oz | $4,000 | $4,200 | +5.00% |
| EUR/USD, dollars per euro | 1.10 | 1.15 | Euro strengthens |
| Gold, EUR/oz | €3,636.36 | €3,652.17 | +0.43% |
Divide the dollar gold price by dollars per euro: 4,000 ÷ 1.10 and 4,200 ÷ 1.15. The stronger euro offsets most of the dollar gain in this example, before fees or taxes.
This checks translation, not a causal model of currency demand. For purchasing-power comparisons over longer periods, use the gold inflation calculator with a clearly stated inflation measure.
5. Record what would weaken your explanation
Write down the counter-evidence before seeing the next price move. Otherwise it is easy to keep changing the story until every possible outcome appears to confirm it.
| Your proposed explanation | Evidence that would weaken it | A better next question |
|---|---|---|
| Falling real yields supported the rally. | Real yields rose throughout the chosen window. | Were currency, flows or other demand changes more relevant? |
| Broad investment inflows drove the move. | The cited number is AUM growth, not inflows. | Did holdings or net creations actually increase? |
| One news event triggered buying. | The price moved before the announcement. | Was the news anticipated, or is another catalyst missing? |
| Every form of physical demand is surging. | Consumer volumes weaken while investment rises. | Which demand categories are changing? |
Opposing evidence does not always settle the matter, but it narrows what you can responsibly claim. An unexplained remainder is better than a precise-looking attribution with no supporting method.
What a rising gold price means for your next decision
A rally explains what someone would have earned over a past window, not what a new buyer will earn. Your costs and holding period begin at your own transaction.
Check whether the price move changed its share of your portfolio relative to your own plan.
Compare the premium, total payment and buyback quote; the headline spot return is not your net return.
Look for assumptions, a horizon and downside scenarios, rather than a single confident price target.
Use the spot, premium and resale-cost guide for the transaction calculation. Read a gold price outlook as conditional scenarios rather than a promised path.
Watch: what a gold rally can tell us
This Bloomberg Originals explainer provides wider context for gold’s role in the world economy. Treat the video’s market references as dated context and use the evidence sheet above for your own period.
FAQ: Why Gold Prices Rise
Why is gold going up today?
That requires current, time-matched evidence. Check the quote, announcement timing, yields, currencies and available flow information; this guide does not claim to diagnose an unverified live session.
Does a rate cut guarantee a gold rally?
No. Expectations may already incorporate the decision, and real yields, the dollar or investor positioning can move differently from the policy rate.
Can gold and the dollar rise together?
Yes. Their relationship is not fixed, and other changes in demand can outweigh the usual currency channel.
Does a rally prove gold is protecting purchasing power?
No. Compare the same period with an appropriate inflation measure and use the currency relevant to your spending.
Is it too late to buy after gold rises?
A recent gain alone cannot answer that. The relevant considerations are your objective, horizon, costs, existing exposure and ability to tolerate a loss.
This guide is educational and does not provide personalized investment advice. Gold produces no income, can experience substantial drawdowns and may not meet your financial objectives.
 When you purchase a service or a product through our links, we sometimes earn a commission, at no extra cost to you.