Read gold charts with timeframe, trend, support, resistance, RSI, MACD, volatility, confirmation, invalidation, and strict risk limits.
- Start with instrument and timeframe before drawing a level or reading an indicator.
- Treat support, resistance, moving averages and RSI as evidence—not automatic buy or sell signals.
- Define confirmation, invalidation and maximum loss before considering a trade; leverage can magnify small errors.
- Spot gold, futures, ETFs and physical bullion do not produce identical charts or execution prices.
- Start with market structure; add moving averages and oscillators as supporting evidence.
- Support and resistance are zones where behavior may change, not guaranteed turning points.
- “Overbought” can persist in a strong trend; RSI alone is not a sell signal.
- Define entry trigger, invalidation and maximum risk before considering a position.
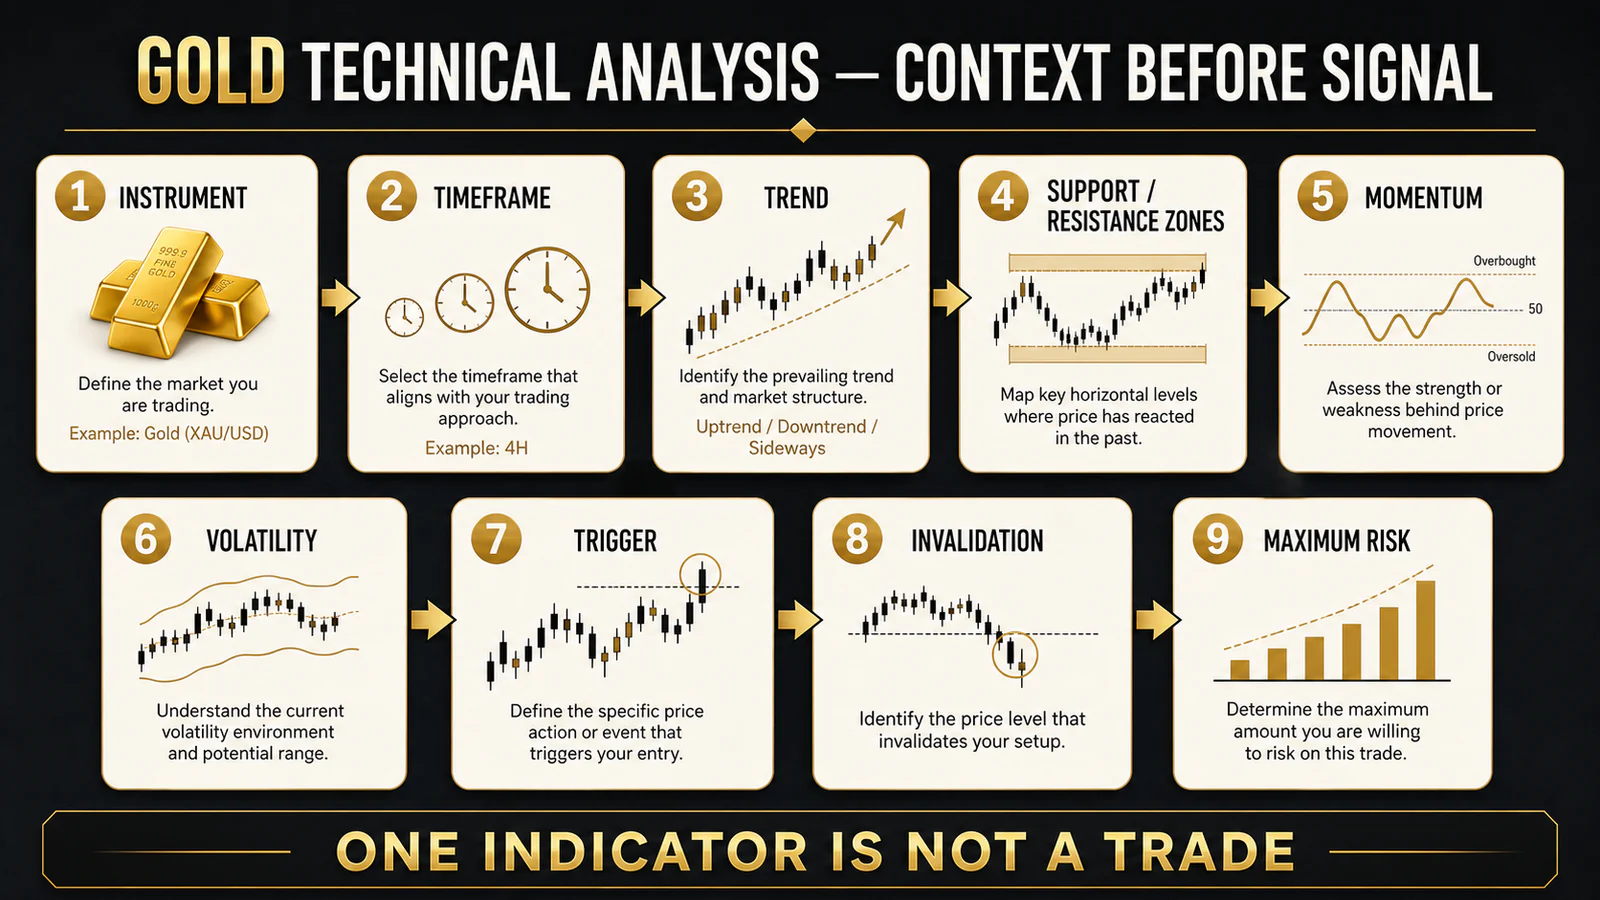
Context before signal
A chart compresses transactions into a visual record. It can show whether buyers have been willing to accept higher prices, where failed moves occurred and how volatile the market has become. It cannot know tomorrow’s inflation release, a central-bank announcement or a sudden geopolitical event. The practical goal is therefore conditional thinking: if price behaves in a defined way, then a setup may be valid.
Step 1: choose the gold instrument
“Gold price” may refer to an OTC spot quote, COMEX futures, an exchange-traded product or a dealer’s physical-bullion offer. Futures have contract months, margin and rollover considerations. An ETF trades during exchange hours and can show a small premium or discount. A coin includes fabrication and dealer spreads. Analyze the instrument you can actually trade, then use other gold markets only as confirmation.
| Instrument | What the chart represents | Main mismatch risk |
|---|---|---|
| Spot or XAU/USD | A broker or data vendor’s cash-market reference | Quotes and session conventions differ by provider. |
| COMEX gold futures | A standardized dated futures contract | Expiry, leverage, margin and contract rollover. |
| Gold ETF or trust | Exchange-traded shares | Trading hours, expenses and premium/discount to NAV. |
| Physical bullion | A dealer transaction | Premium, spread, shipping, assay and settlement costs. |
For spot-price versus transaction-price mechanics, use Gold Today and the live gold price reference as timestamped inputs—not promises of an executable price.
Step 2: fix the timeframe before drawing
A weekly chart can be in an uptrend while a four-hour chart is correcting. That is not a contradiction. Use a higher timeframe to define regime and important zones, a decision timeframe for the setup, and—only if needed—a lower timeframe for execution. Changing timeframe after a loss is not analysis; it moves the goalposts.
Step 3: read trend and market structure
An uptrend commonly forms higher swing highs and higher swing lows; a downtrend forms lower highs and lower lows. A range alternates between boundaries without sustained progress. Mark obvious swings before adding indicators. If the structure is unclear, “no trade” is a valid conclusion.
A structure break matters more when price closes beyond a well-tested zone, participation expands and the next session does not immediately reclaim the prior range. A single wick through a line can be a liquidity sweep, data variation or failed breakout. Treat it as evidence to investigate rather than automatic confirmation.
Step 4: map support and resistance as zones
CME Group describes prior highs and lows, trend lines and moving averages as common reference points. Draw broad zones around repeated reactions instead of pretending every market participant sees the same exact cent. A former resistance zone can become support after a clean break and successful retest, but role reversal can fail.
Score a zone by independent evidence: repeated reactions, higher-timeframe visibility, recency, the speed of departure and whether volume or momentum confirms the response. Avoid filling the chart with so many lines that every price becomes “important.”
Moving averages: trend filters, not magic numbers
A moving average smooths price. Shorter averages react faster and create more false turns; longer averages react slower and confirm only after much of the move has occurred. Price above a rising average supports a bullish regime, while a crossover can describe a change in recent behavior. Neither establishes fair value or guarantees continuation.
The popular 50- and 200-period averages attract attention, but their meaning depends on timeframe and instrument. Test the same definition consistently. A 200-hour average is not equivalent to a 200-day average.
RSI, MACD and ATR answer different questions
| Tool | Question it helps answer | Common misuse |
|---|---|---|
| RSI | How strong has recent upward versus downward movement been? | Treating 70 as an automatic sell or 30 as an automatic buy. |
| MACD | Is trend momentum accelerating, decelerating or crossing its signal reference? | Entering on every crossover without structure or timeframe context. |
| ATR | How large has the recent trading range been? | Using it to predict direction instead of sizing volatility. |
Momentum divergence can warn that a trend is losing force, but divergence can persist while price continues. ATR helps place a stop beyond ordinary noise and normalize position size; it does not identify the correct direction. Combine each tool with price structure rather than stacking correlated indicators until they appear unanimous.
A repeatable breakout test
- Was the level visible before the move?
- Did the decision-timeframe candle close beyond the zone?
- Was the move large relative to recent ATR, or merely a marginal wick?
- Did momentum expand without an immediately exhausted spike?
- Did price hold beyond the zone or survive a retest?
- Is a scheduled macro event likely to make the signal obsolete?
- Where is invalidation, and is the reward worth the defined risk?
Worked risk example
Assume a hypothetical account of $20,000 and a maximum loss of 0.5%, or $100. A setup enters at $3,400 per ounce and is invalid below $3,375, a $25 risk per ounce before slippage and fees.
The tradable size must then be adjusted for the instrument’s contract size, spread, slippage and gap risk. A standard futures contract may be far too large; leverage should never be used simply to force the arithmetic to fit.
Technical and macro analysis belong in the same process
The World Gold Council’s Gold Return Attribution Model groups gold drivers around economic expansion, risk and uncertainty, opportunity cost and momentum. Technical structure can show how the market is reacting; real yields, the dollar, investment flows and official demand help explain the environment. Neither perspective is complete alone.
Review the current framework in gold price factors, why gold prices rise, gold price outlook and how AI predicts gold price trends.
A chart journal that improves decisions
Save the chart as it looked before entry. Record instrument, timeframe, regime, setup, trigger, invalidation, scheduled events, expected holding period and maximum loss. After exit, separate process quality from profit. A good setup can lose; a bad process can get lucky. Thirty consistently documented observations teach more than one perfect-looking historical example.
False breakouts, gaps and event risk
Gold trades across overlapping global sessions, so liquidity changes through the day. A move during a thin period can reverse when London or New York participation arrives. Futures can also open away from a prior settlement after weekend news. A stop limits ordinary price risk, but it cannot guarantee the fill price during a gap.
Before a major inflation release, employment report or central-bank decision, spread and volatility can expand while previously clean levels fail. Decide in advance whether the setup permits event exposure. Reducing size or staying flat is a risk decision, not a failure to predict the announcement.
Backtesting without fooling yourself
Write the rule before viewing the outcome: exact instrument, data source, timeframe, entry, stop, exit, costs and sample period. Include losing trades, parameter changes and out-of-sample testing. A rule optimized on one gold regime can collapse when volatility or monetary conditions change. Paper results also omit slippage, execution delay and the psychological difficulty of following a drawdown.
Compare expectancy rather than win rate alone. A strategy that wins 70% but loses four times as much on failures can be worse than one that wins 40% with controlled losses. Maximum drawdown and the sequence of losses determine whether the method is survivable.
Many gold-analysis pages publish exact levels without the chart source, instrument, timezone or timestamp. The number becomes stale while retaining false authority. Durable analysis documents how the zone was derived and what future behavior would confirm or invalidate it.
The strongest technical analyst is not the person with the most indicators. It is the person who can state the setup in one sentence, identify the evidence against it and keep one failed idea from becoming a portfolio-level problem.
This article is educational, not personalized investment advice or a trading signal. Gold, ETFs and futures can fall. Futures and leveraged products can produce losses beyond the initial amount committed. Use current contract specifications and qualified advice.
Video context This Charles Schwab explainer shows how moving averages describe trend. Use it as one layer inside the broader workflow above, not as a standalone signal.
Bottom Line
Gold technical analysis works best as a sequence: instrument, timeframe, structure, zones, momentum, volatility, trigger, invalidation and maximum risk. It cannot remove uncertainty, but it can turn a vague opinion into a defined, reviewable decision.
FAQ: Gold Technical Analysis
Which timeframe is best for gold technical analysis?
There is no universal best timeframe. Match it to the intended holding period and use a higher timeframe for regime, a decision timeframe for the setup and an optional lower timeframe for execution.
Is RSI above 70 a sell signal for gold?
No. It describes strong recent momentum and can remain elevated in a trend. Look for structure, failure, divergence and confirmation before drawing a conclusion.
Do support and resistance levels work on gold?
They can identify zones where behavior previously changed, but they are not barriers. Treat reactions, closes and retests as probabilistic evidence.
Should I analyze spot gold or futures?
Analyze the instrument you can trade. Use related markets for confirmation while accounting for contract months, trading hours, fees and spreads.
Can technical analysis predict the gold price?
It cannot predict with certainty. It organizes observed behavior into conditional scenarios and risk limits.
Sources and verification
Primary and specialist sources are linked below. Rules, market data and product specifications can change; verify the dated source before acting.
- CME Group — Support and Resistance — Zones, previous highs/lows, moving averages and role reversal.
- CME Group — Understanding Moving Averages — Moving-average interpretation and crossover limits.
- CME Group — Oscillators — RSI, MACD and oscillator context.
- CFTC — Futures Glossary — Regulatory definition of technical analysis and market terms.
- CFTC — Futures Market Basics — Futures, margin and retail risk.
- CFTC — Social-Media Metals Advisory — Hype, leverage and risk-capital warnings.
- World Gold Council — Gold Return Attribution Model — Long- and short-term gold drivers.
- World Gold Council — Mid-Year Outlook 2026 — Current technical and macro interaction with dated data.
- World Gold Council — Market Size and Structure — Spot, OTC and derivatives market structure.
- CFTC — Gold Is No Safe Investment — Leverage and guaranteed-return warning.
 When you purchase a service or a product through our links, we sometimes earn a commission, at no extra cost to you.