

See how AI models forecast gold trends, which data they use, how leakage and regime shifts mislead, and how to validate predictions responsibly.
- AI learns statistical patterns from dated market and macro data; it does not know the future or understand every shock.
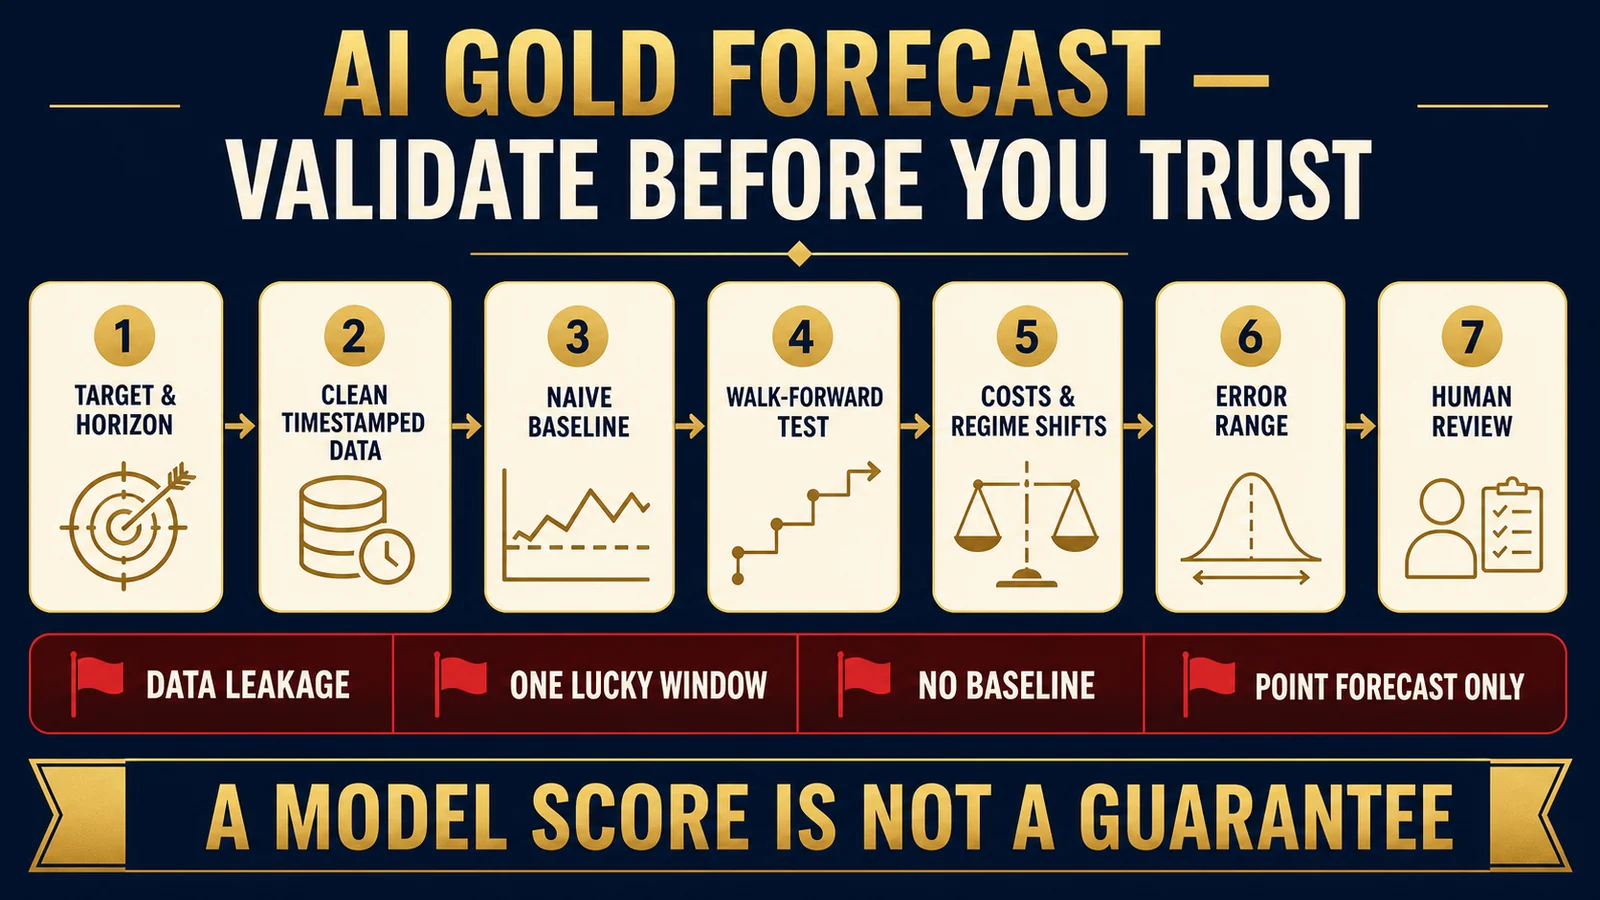
- A credible model beats simple baselines in walk-forward tests and reports an error range—not just one target price.
- Data leakage, overfitting, regime shifts and ignored trading costs can turn an impressive backtest into a useless forecast.

- Define instrument, target and horizon before choosing a model.
- Gold-price levels are non-stationary; returns, direction and volatility are different prediction tasks.
- Randomly shuffling time-series data can leak the future into training.
- Compare AI with naive forecasts and evaluate multiple market regimes.
- Use uncertainty, costs and human review; never turn a backtest score into certainty.
A forecast is a pipeline, not an algorithm name
“AI predicts gold” can mean anything from a linear regression to gradient-boosted trees, recurrent neural networks, transformers or a language model summarizing news. Model complexity is the least important fact until the target, data timing and validation design are clear.
Step 1: define what is being predicted
| Target | Example question | Main trap |
|---|---|---|
| Price level | What will XAU/USD close at tomorrow? | A model can look accurate simply because today and tomorrow are close. |
| Return | What percentage change occurs over five sessions? | Noise is large relative to signal. |
| Direction | Is the next weekly return positive? | Accuracy ignores size and class imbalance. |
| Volatility | How wide might the next month’s range be? | Direction remains unknown. |
| Regime | Is gold trending, ranging or stressed? | Regime labels can be subjective and unstable. |
The instrument matters too. LBMA reference prices, spot feeds, COMEX futures, ETFs and dealer prices have different timestamps and frictions. A model trained on a London benchmark cannot be presented as an executable retail coin quote.
Step 2: construct a point-in-time dataset
Each feature must contain only information available when a prediction would have been made. Macroeconomic series are released with delays and sometimes revised. ETF flows, central-bank data and commitments reports have publication schedules. Using the final revised value on an earlier date is look-ahead bias.
A robust dataset records source timestamp, observation timestamp, release timestamp, revision vintage, timezone and missing-value policy. It also handles futures rollovers, holidays, changing market hours and corporate-product changes for ETFs.
Step 3: start with a baseline
A naive price-level forecast can simply use the latest price. A return forecast may use zero. A directional model can use the historical majority class, while a volatility model can use recent realized volatility. If the AI does not reliably improve on these cheap baselines, complexity has not created decision value.
Compare against transparent statistical models as well: linear or logistic regression, ARIMA-family forecasts and simple moving-window rules. The best benchmark depends on the target. A deep network should not receive credit merely for learning persistence.
Step 4: train without contaminating the future
Ordinary random cross-validation assumes observations are exchangeable. Financial time series violate that assumption. Use expanding-window or rolling-window evaluation: train on earlier data, predict the next untouched block, advance the clock and repeat. Scikit-learn’s TimeSeriesSplit documents this chronological principle.
Hyperparameters must be selected inside the training history, not after inspecting the final test. Preprocessing, feature selection and sentiment dictionaries must also be fit without future information. Otherwise the “out-of-sample” label is cosmetic.
- Exact target, instrument, currency and horizon
- Training, validation and final test dates
- Release-lag and revision handling
- Baseline results beside the AI result
- Walk-forward performance for every window
- Errors by calm, inflation, crisis and trend regime
- Transaction costs, spread and turnover if a strategy is claimed
- Prediction interval calibration and worst drawdown
- A locked final test that was not used for tuning
Which models are used?
Tree ensembles such as random forests and gradient boosting can model nonlinear interactions and often work well with engineered tabular features. LSTM and GRU networks process sequential dependencies, while convolutional models extract local patterns. Transformers use attention to combine longer contexts. Hybrid studies may decompose a series before prediction.
None escapes the data problem. A sophisticated architecture can overfit small samples, unstable correlations and a single historical regime. Interpretability tools can show which features influenced a prediction, but an explanation of the model is not proof that the relationship is causal.
How text sentiment enters a gold model
Natural-language models can score central-bank statements, news and social posts for tone, topic or surprise. Good systems timestamp each document, deduplicate syndicated stories, separate publication from event time and prevent later summaries from entering earlier forecasts. They also measure whether text adds value beyond market variables.
Language models are especially vulnerable to narrative leakage: a retrospective article may explain a move using facts that were not known at the start. Social data add bots, selection bias and platform drift. Sentiment should be treated as a noisy feature, not an oracle.
Metrics can tell conflicting stories
| Metric | What it measures | What it can hide |
|---|---|---|
| MAE / RMSE | Average size of numeric errors | Direction and economic usefulness |
| MAPE | Percentage error | Instability near zero and price-level persistence |
| Directional accuracy | Share of signs predicted correctly | Magnitude, class imbalance and costs |
| AUC / F1 | Classification discrimination | Calibration and profit/loss asymmetry |
| Sharpe ratio | Return per unit of variability | Tail risk, selection bias and changing costs |
| Calibration | Whether predicted probabilities match outcomes | Whether the opportunity is large enough to act on |
Report several metrics and compare them across windows. Confidence intervals matter because a few trades or one crisis can dominate a result. Multiple model searches also create a data-mining problem: the best of hundreds of experiments may look exceptional by chance.
Regime shifts are the central failure mode
Gold’s relationships with real yields, the dollar, inflation and risk change. Central-bank purchasing, sanctions, ETF market structure and the level of algorithmic participation also evolve. A model trained mainly on one monetary regime can fail when policy, liquidity or investor behavior changes.
Monitor input distributions, residuals, calibration and baseline-relative performance. Retraining on recent data can adapt but also forget rare events. Ensembling across horizons and models may reduce dependence on one specification; it cannot eliminate structural breaks.
Reproducibility and model governance
A serious forecast should be reproducible from a versioned dataset and code commit. Record vendor symbols, transformation formulas, release calendars, training seeds and all excluded observations. If a data vendor silently backfills history or changes a benchmark methodology, the model owner needs a documented impact review.
Governance also separates research from production. A researcher can propose features, but an independent reviewer should challenge leakage, economic rationale and test selection. Production systems need access control, monitoring thresholds, rollback plans and a clear owner who can suspend a model when inputs fail or behavior drifts.
Large language models can help classify documents and explain scenarios, yet they can invent citations or infer facts absent from the input. Preserve the source text, model version and prompt; require deterministic checks for dates and numbers. A fluent narrative is not an audit trail.
Forecast ranges are more honest than targets
A point estimate hides the distribution of plausible outcomes. Quantile models, bootstrapped residuals or probabilistic forecasts can provide intervals, but those intervals must be calibrated: events labeled 70% should occur close to 70% over a sufficiently large relevant sample. During a regime shift, historical intervals can be too narrow.
Decision makers should know how an interval changes with horizon and what tail events are excluded. The range is not a promise that price must remain inside it; it is a conditional statement based on data and model assumptions.
Worked example: an honest weekly forecast
A model predicts the probability that next week’s LBMA-related gold return is positive. Inputs include lagged weekly return, four-week volatility, a real-yield change, broad-dollar change and fully released positioning data. Training expands from 2006 onward; each year is predicted before it is added to training.
The AI achieves 55% directional accuracy versus 52% for a baseline. After estimated costs, performance is concentrated in two crisis windows and probability calibration weakens after 2022. The correct conclusion is not “AI predicts gold.” It is “a small historical edge requires regime monitoring and may not survive implementation.”
How a reader should use an AI forecast
Demand the forecast timestamp, horizon, range, baseline and invalidation conditions. Prefer scenario outputs—such as probabilities under falling real yields or a stronger dollar—over one exact target. Separate research support from position sizing and suitability.
Use the framework with gold technical analysis, gold price factors, why gold is going up, gold price outlook, spot versus transaction prices and gold in recessions.
Many published gold-forecast studies report one split and one error metric but omit data vintages, costs, baseline stability and repeated model selection. Those omissions make impressive numbers difficult to reproduce and easy to overinterpret.
AI is most useful when it makes uncertainty explicit, catches interactions humans miss and forces disciplined testing. It is least useful when a precise target hides an unspecified horizon, revised data and an unreported baseline.
This is an educational model-validation guide, not a gold-price forecast or investment recommendation. Models can fail abruptly, historical relationships can reverse and implementation costs can exceed a small statistical edge.
Watch: Machine Learning Fundamentals: Cross Validation
Cross-validation is the core idea behind honest model comparison. For time series, preserve chronology and use forward windows rather than random shuffling.
Video: StatQuest with Josh Starmer. Availability validated July 16, 2026.
Bottom Line
AI can organize large, noisy gold datasets into conditional forecasts. Trust begins only after precise target definition, point-in-time data, naive baselines, walk-forward testing, regime analysis, uncertainty ranges and cost-aware human review.
Frequently Asked Questions
Can AI accurately predict the gold price?
It can sometimes improve a defined forecast over a specific sample, but accuracy varies by horizon and regime. No model guarantees the future.
Which AI model is best for gold?
There is no universal winner. A simple model with clean data and honest validation can outperform a deep network.
What data does a gold AI model use?
Common inputs include price history, volatility, yields, currencies, flows, positioning, risk indicators and timestamped text.
Why is random cross-validation wrong for gold time series?
It can train on observations that occur after the test sample, leaking future structure into the result.
Should I trade an AI gold forecast?
Not without independent validation, costs, risk limits and suitability analysis. A forecast is one input, not a position instruction.
Sources and verification
These sources define the material, market, engineering or regulatory boundaries used above. Check the current document and product-specific evidence before acting.
- LBMA — Precious metal prices
- FRED — 10-Year real interest rate
- FRED — Trade weighted U.S. dollar index
- CFTC — Commitments of Traders
- World Gold Council — Gold Return Attribution Model
- World Gold Council — Gold demand data
- scikit-learn — TimeSeriesSplit
- Bank for International Settlements — Machine learning in finance
- Sosyoekonomi — Machine learning gold forecasting study
- Stanford CS230 — Gold price prediction using CNN-LSTM
 When you purchase a service or a product through our links, we sometimes earn a commission, at no extra cost to you.