

Understand gold demand across jewelry, bars, coins, ETFs, central banks, technology and OTC activity—and read the data correctly.
- One total combines six very different demand channels
- Tonnes and dollar value answer different questions
- A flat headline can hide major shifts underneath

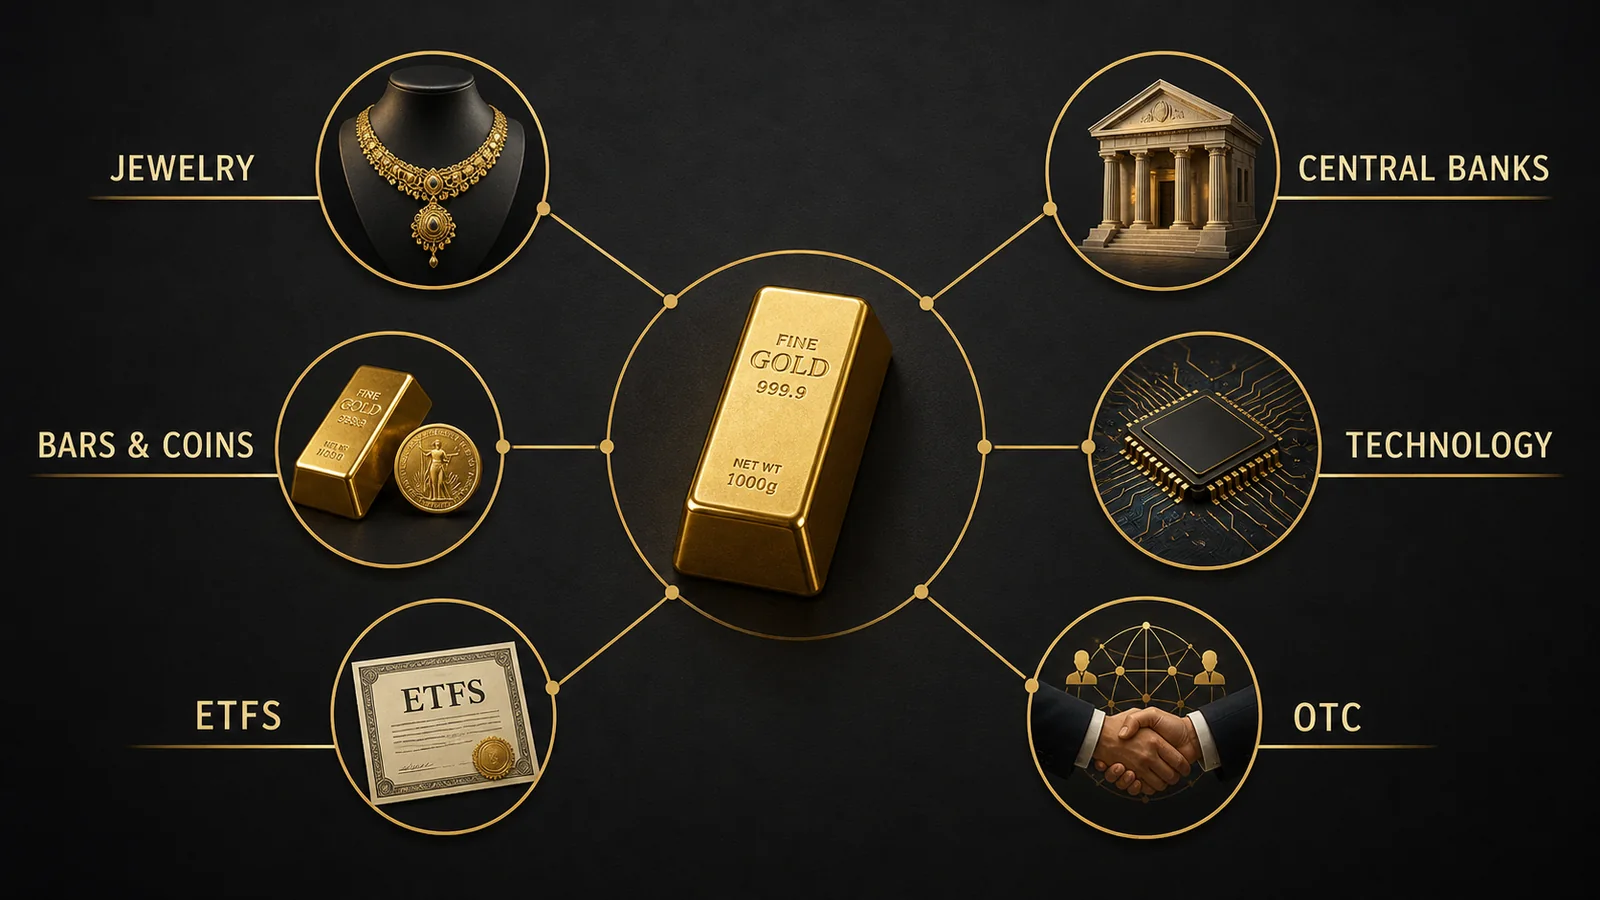
Gold demand trends describe how much gold is bought or used across jewelry, bars and coins, exchange-traded funds, central banks, technology and over-the-counter transactions. The headline total is only a starting point: one channel can grow while another contracts, and demand measured in tonnes can tell a different story from demand measured in dollars.
TL;DR
- World Gold Council data put total second-quarter 2026 demand, including over-the-counter activity, at about 1,269 tonnes—roughly unchanged from a year earlier.
- That stable total concealed very different movements: bar-and-coin demand remained firm, central banks bought 289 tonnes and gold ETFs recorded a 45-tonne quarterly outflow.
- Always compare tonnes, value, channel mix and reporting period before treating a demand headline as bullish or bearish.
“Gold demand is up” sounds simple. It rarely is. A high price can reduce jewelry volumes while increasing the dollar value of the gold sold. Investors can withdraw from exchange-traded funds in the same quarter that households buy more small bars and coins.
This guide turns the quarterly numbers into a practical reading system. It uses the World Gold Council’s Q2 2026 Gold Demand Trends report as a dated example, not as a permanent forecast.
What counts as gold demand?
Gold demand is the quantity of metal purchased or consumed by identifiable end-use and investment channels during a defined period. Standard market reports separate fabrication, physical investment, fund flows, official-sector purchases and estimated over-the-counter activity because each responds to different incentives.
| Channel | What it measures | What usually matters most |
|---|---|---|
| Jewelry | Gold used in finished jewelry, adjusted for recycling within the trade | Local price, income, weddings, festivals and consumer confidence |
| Bars and coins | Retail and institutional purchases of physical investment products | Inflation concerns, currency risk, premiums and access |
| Gold ETFs | Net metal added to or removed from physically backed funds | Interest rates, portfolio flows, price momentum and risk sentiment |
| Central banks | Reported and estimated net official-sector purchases | Reserve diversification, liquidity, sanctions and custody policy |
| Technology | Gold used in electronics, dentistry and other industrial applications | Device production, miniaturization, substitution and recycling |
| OTC and other | Estimated activity outside transparent exchange and retail channels | Institutional transactions, stock changes and data balancing |
The categories are related but not interchangeable. An ETF share is a liquid financial exposure; a minted coin is a physical product with fabrication and dealer costs. Our guide to how a gold ETF works explains that distinction in more detail.
A clear reading of the Q2 2026 snapshot
The quarterly figures below are rounded from the World Gold Council report. They provide a useful case study because the total appears calm while the components move in opposing directions.
| Measure | Q2 2026 | How to interpret it |
|---|---|---|
| Total demand including OTC | 1,268.9 tonnes | Broad market total; roughly flat year over year |
| Jewelry consumption | 278.2 tonnes | High prices continued to constrain volumes |
| Bars and coins | 307.1 tonnes | Physical investment remained an important source of demand |
| Gold ETFs | −44.8 tonnes | Fund holdings contracted during the quarter |
| Central banks and institutions | 288.9 tonnes | Official buying remained substantial |
| Technology | 80.4 tonnes | A smaller but comparatively stable end-use channel |
| Mine production | 965.6 tonnes | Newly mined supply, not demand |
| Recycled gold | 326.1 tonnes | Existing metal returned to market |
First-half tonnage rose only 2%, but its value reached about $380 billion. That difference matters: value can surge because the gold price is higher even when the physical quantity changes modestly.
Tonnes and dollars answer different questions
Tonnes tell you how much metal changed hands or was used. Dollar value tells you how much money buyers spent at the prevailing price. Neither metric is “better”; they answer different questions.
Suppose jewelry tonnage falls 10% while the average gold price rises 25%. Consumers bought less metal, yet total spending may still increase. A headline focused only on sales value could imply strong volume demand when affordability actually weakened.
The same distinction applies to reserves and ETFs. Their dollar value can rise without a single additional bar being acquired. To understand behavior, look for net tonnage changes; to understand financial scale, look at value.
Why ETF flows and bar demand can disagree
ETFs are frequently used by professional and self-directed investors who prioritize liquidity and easy portfolio rebalancing. Bars and coins appeal to buyers who want direct physical possession or allocated storage. Different ownership motives create different reactions to the same market event.
In Q2 2026, ETFs lost about 45 tonnes while bars and coins absorbed more than 307 tonnes. That is not a data contradiction. It signals that one investment channel experienced net selling while another continued to attract physical buyers.
Monthly data can also reverse the quarterly impression. The World Gold Council’s June and first-half ETF report showed June outflows of 74 tonnes, yet global holdings were still 18 tonnes higher over the full first half. Always match the period in the headline to the period in the table.
Central banks are structural buyers—but not a price floor
Official institutions bought almost 289 tonnes in the quarter. Their decisions often have longer horizons than retail trading and can reflect reserve diversification rather than a short-term price view. Our companion guide explains why central banks buy gold, including custody and liquidity considerations.
Strong official demand may support the market, but it cannot prevent corrections. Futures positioning, real interest rates, the U.S. dollar, ETF flows and profit-taking can dominate shorter periods. Read official buying as one part of the broader set of gold price factors.
Jewelry demand is often an affordability signal
Jewelry is both adornment and a store of value in many markets. When prices rise quickly, consumers may buy lighter pieces, delay purchases or exchange old gold. The metal content falls even when the cultural role remains intact.
This is especially important when reading demand from large Asian markets. Local currency moves, import duties and retail premiums can make the consumer price differ from the international benchmark. Broad stories about gold demand in emerging markets need this local context.
Technology is small, steady and easy to overlook
Gold’s conductivity, corrosion resistance and reliability make it useful in electronics and specialized applications. At roughly 80 tonnes for the quarter, technology was much smaller than jewelry or investment demand, but it provides an industrial base independent of investment narratives.
Technology demand usually changes gradually because manufacturers continually reduce material use and recycle production scrap. A boom in electronic devices does not translate one-for-one into gold consumption.
Demand must be read alongside supply
Gold does not disappear when it is sold. Nearly all gold ever mined still exists in some form, which makes above-ground stocks unusually important. New mine production adds supply; recycling returns existing jewelry, bars and industrial material to the market.
Q2 mine production rose to about 966 tonnes while recycled supply was around 326 tonnes. Recycling declined despite a high average price, showing why price alone does not determine selling: households may expect further gains, lack convenient access or view their gold as long-term savings. See our guide to how gold recycling works.
Knowledge Gap: a stable total can hide a changing market
Many summaries report total demand and stop there. The overlooked question is who changed behavior. In this quarter, ETF outflows, resilient physical investment and continued central-bank buying offset one another. That channel mix can affect liquidity and future price sensitivity even when the headline tonnage barely moves.
OTC demand is also partly estimated, and historical data can be revised. Treat the last decimal place as accounting precision—not certainty about every transaction.
How to read any gold demand report in six steps
- Confirm the period. Do not compare one month with a full quarter or a calendar year.
- Check whether OTC is included. Headline totals can differ depending on the definition.
- Compare tonnes and value. Separate buyer behavior from the effect of a higher or lower price.
- Open the channel table. Identify which categories created the net change.
- Review supply. Mine production and recycling shape the balance available to meet demand.
- Avoid turning history into a forecast. Demand reports describe a period that has already ended.
For a forward-looking view, combine this framework with the measurable signals in our gold indicators guide and the scenario-based gold price outlook. No single demand number should determine a buy or sell decision.
The GoldConsul Editorial Perspective
The best gold-demand analysis is less dramatic than most headlines. Start with definitions, split the total into channels, and ask whether a change came from quantity, price or estimation. This makes the report useful without pretending that a backward-looking table can predict the next move.
Video context: This World Gold Council explainer introduces the major categories used in Gold Demand Trends reports. Use it as a map, then return to the dated tables for the actual numbers.
Bottom line
Gold demand trends are useful when they reveal the mix of buyers, not merely the grand total. In Q2 2026, flat overall tonnage coexisted with ETF selling, robust bars and coins, major central-bank purchases and restrained jewelry volumes.
Read the report as a market anatomy lesson. It can explain what happened and where pressure developed, but it cannot promise what the gold price will do next.
This article is for education only and is not financial, investment, legal or tax advice. Historical demand, fund flows and official purchases do not guarantee future prices or returns.
FAQ: Gold demand trends
Who publishes the main global gold demand data?
The World Gold Council publishes the widely used quarterly Gold Demand Trends series using market research and multiple data sources. Its methodology includes estimates, particularly for less transparent channels, so figures may be revised.
Does higher gold demand always increase the price?
No. Price reflects both demand and supply, as well as expectations, derivatives positioning, currencies and interest rates. A demand category can rise while the overall price falls.
Why can gold ETF demand be negative?
ETF demand is reported as net metal flows. It becomes negative when redemptions and sales cause participating institutions to remove more gold from fund holdings than they add.
Is jewelry an investment or consumer demand?
Official tables classify it as fabrication and consumer demand, but motivation varies. In some cultures jewelry also acts as portable savings, so the economic boundary is not always neat.
What is OTC gold demand?
OTC means over the counter: transactions negotiated outside transparent exchanges and retail channels. Because the market is less visible, reports estimate parts of this activity and use it to help reconcile the broader balance.
 When you purchase a service or a product through our links, we sometimes earn a commission, at no extra cost to you.