
Track the gold indicators that matter most, including real yields, the dollar, inflation, central banks, ETF flows, and market stress signals over time.
- No single gold indicator works like a price forecast.
- Compare real yields, the dollar, inflation expectations, flows, and trend.
- Use indicators to frame risk, not to justify automatic buying or selling.

Gold indicators are not crystal balls. They are signals that help you understand why gold may be rising, falling, or moving sideways at a given moment.
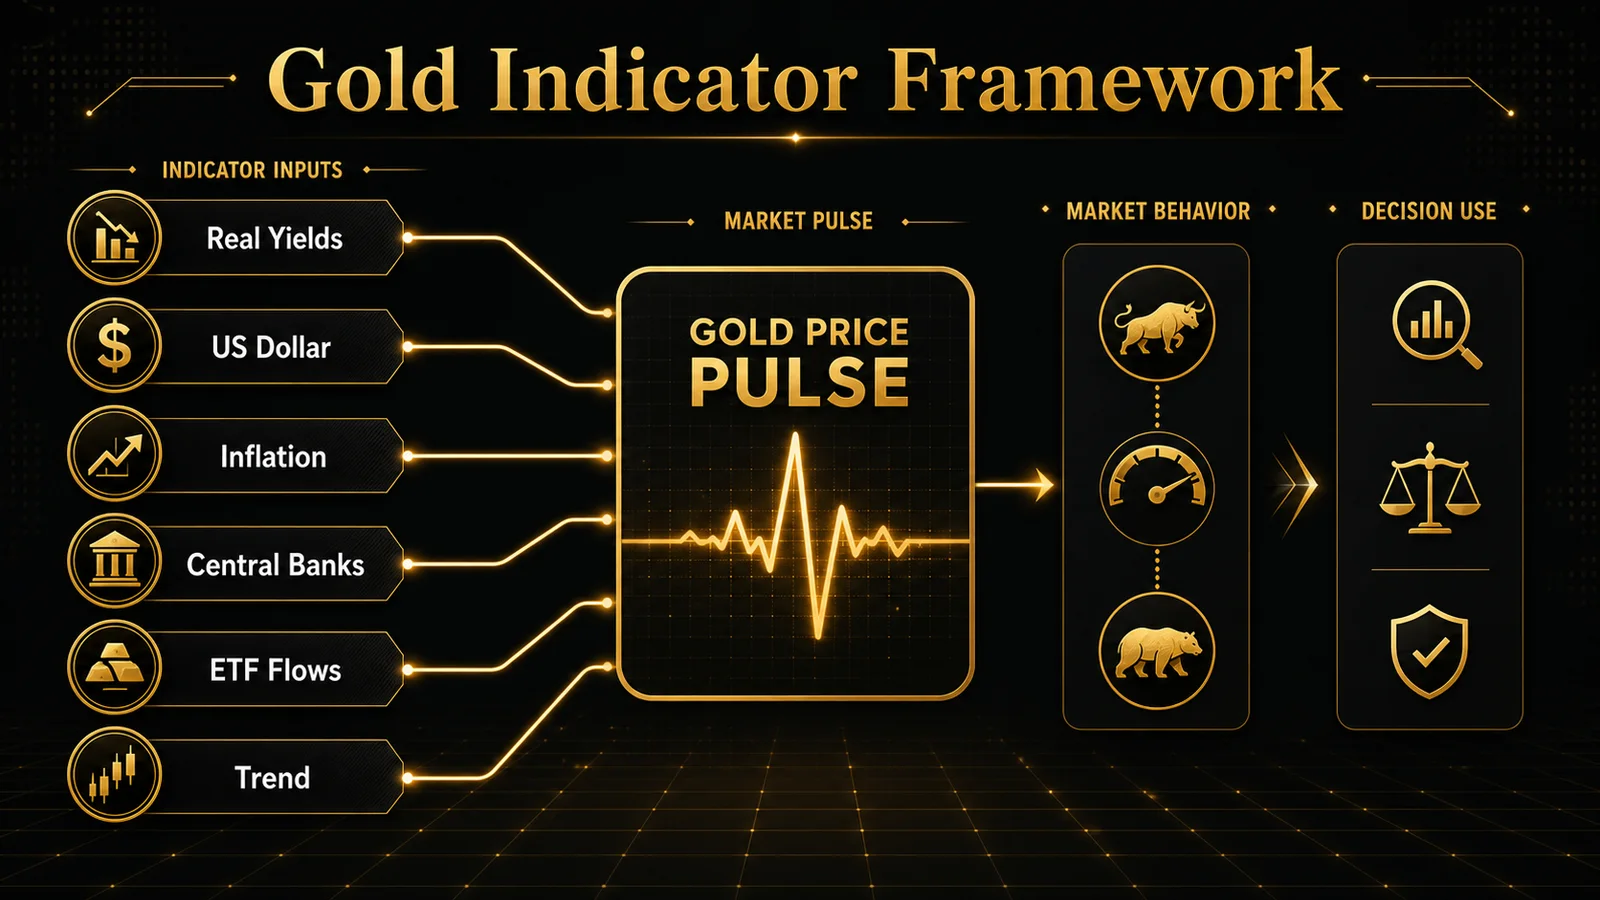
The useful approach is not to chase one headline. It is to compare several indicators together: real yields, the U.S. dollar, inflation expectations, central-bank demand, ETF flows, futures positioning, and price trend.
TL;DR: Gold Indicators
- Real yields and the U.S. dollar often explain short-term pressure on gold, but they do not explain every move.
- Central-bank buying, ETF flows, and physical demand help show whether gold demand is broad or concentrated.
- Technical indicators are useful for timing and risk control, not for proving a long-term thesis by themselves.
- The best read comes from a dashboard: macro, flows, sentiment, and price behavior checked together.
This article is educational only. It is not financial, investment, tax, or legal advice. Gold can rise or fall in price, and any allocation decision should be based on your own objectives, risk tolerance, and professional guidance where needed.
What Gold Indicators Actually Tell You
A gold indicator is any measurable signal that gives context for the gold price. Some indicators track opportunity cost, such as real interest rates. Others track demand, such as central-bank purchases or gold ETF flows.
The mistake is treating one indicator as a command. A falling dollar can support gold, but gold can still drop if real yields rise sharply or investors reduce risk exposure.
For a broader foundation on the asset itself, start with gold today. If you are comparing ways to gain exposure, our guide on how to invest in gold explains the major routes.
Indicator Comparison and Decision Table
| Indicator | What It Measures | Gold-Positive Reading | Decision Use | Main Limitation |
|---|---|---|---|---|
| Real yields | Inflation-adjusted bond returns | Falling or deeply negative real yields | Macro backdrop and opportunity cost | Can be overridden by crisis demand or flows |
| U.S. dollar | Purchasing power of the pricing currency | Dollar weakness | Cross-market confirmation | Gold and the dollar can rise together in stress periods |
| Inflation expectations | Market view of future purchasing power | Rising inflation concern with stable or falling yields | Hedge narrative check | High inflation with aggressive rate hikes can pressure gold |
| Central-bank demand | Official-sector accumulation or selling | Sustained net purchases | Longer-term demand quality | Reported with a lag and uneven transparency |
| ETF flows | Investor demand for exchange-traded gold exposure | Persistent inflows | Institutional sentiment check | Can reverse quickly when yields or risk appetite change |
| Technical trend | Price behavior, momentum, support, resistance | Higher highs, higher lows, constructive momentum | Timing, entry discipline, risk boundaries | Can whipsaw without macro confirmation |
The Macro Indicators: Real Yields, Dollar, and Inflation
Real yields
Real yields are one of the most watched gold indicators because gold does not pay interest. When inflation-adjusted bond yields rise, holding gold becomes more expensive in opportunity-cost terms.
For a practical reference point, many analysts monitor the U.S. 10-year Treasury inflation-indexed yield, available through FRED. A falling real-yield trend is often a friendlier backdrop for gold than a rising real-yield trend.
U.S. dollar
Gold is globally traded but commonly quoted in U.S. dollars. A stronger dollar can make gold more expensive for non-dollar buyers, while a weaker dollar can provide price support.
This relationship is useful but imperfect. During periods of acute financial stress, both gold and the dollar can attract defensive flows at the same time.
Inflation expectations
Gold is often discussed as an inflation hedge, but the cleaner signal is not inflation alone. The important question is whether inflation concern is rising faster than nominal yields.
If inflation expectations rise while real yields fall, gold often has a more supportive macro setting. If inflation rises and central banks respond with aggressive rate increases, the signal becomes mixed.
Demand Indicators: Central Banks, ETFs, and Physical Market Clues
Macro explains part of the price, but demand explains who is actually buying. The World Gold Council’s Gold Demand Trends is a useful recurring source for central-bank demand, jewelry demand, investment demand, and ETF flows.
Central-bank buying matters because it is usually strategic rather than tactical. It can reflect reserve diversification, geopolitical risk management, or a desire to reduce reliance on a single currency system.
ETF flows are more sensitive to investor sentiment. Persistent inflows can confirm broad investor interest, while outflows can show that financial investors are reducing exposure even if physical demand remains steady.
Physical market clues also matter. Premiums, spreads, dealer inventory, and buyback terms can tell you whether demand is tight in the retail bullion market. For product-level context, see what gold and silver bullion means and our guide to where to store gold.
Technical Indicators for Gold
Technical indicators do not explain why gold should be valued a certain way. They help you read price behavior once the market is already moving.
Common tools include moving averages, trend lines, support and resistance, relative strength, and volume. A 50-day moving average above a 200-day moving average can suggest trend strength, but it should not be treated as a guarantee.
Technical work is most useful when it sets process boundaries. It can help define where a thesis is wrong, where momentum is fading, or where a price move is extended. For a deeper look, read our overview of gold technical analysis.
How to Build a Gold Indicator Dashboard
A practical dashboard should separate indicators by purpose. Macro indicators describe the environment. Flow indicators describe demand. Technical indicators describe timing.
- Weekly macro check: real yields, U.S. dollar trend, inflation expectations, central-bank language.
- Monthly demand check: central-bank purchases, ETF flows, jewelry demand, bar and coin demand.
- Price-behavior check: trend, support, resistance, volatility, and whether breakouts are confirmed.
- Product-market check: bullion premiums, spreads, storage costs, liquidity, and dealer buyback policies.
If you use gold as a portfolio diversifier, the dashboard should reduce impulse decisions. If you trade gold, it should help separate signal from noise.
Editorial Perspective
The strongest gold analysis is humble. Gold can respond to real yields one month, central-bank demand the next, and geopolitical stress the month after that.
Our view is that readers should avoid single-cause explanations. A well-built indicator dashboard is more useful than a confident forecast with weak evidence.
Knowledge Gap
The public data on gold is good, but not complete. Some central-bank activity is reported with delays, over-the-counter trading is less transparent than exchange trading, and retail premiums vary by region.
That means gold indicators should be read as probabilities and context, not as a complete map of every buyer and seller in the market.
Common Mistakes When Reading Gold Indicators
- Using one signal: real yields matter, but they are not the only driver.
- Ignoring time frame: a short-term trader and a long-term allocator may read the same data differently.
- Confusing price with value: a rising price does not automatically mean gold is cheap or expensive.
- Skipping costs: spreads, premiums, storage, and insurance affect realized outcomes.
- Overtrusting forecasts: forecasts can frame scenarios, but they should not replace risk controls.
The London bullion market also has its own pricing infrastructure. For benchmark context, the LBMA precious metal prices page explains the published reference prices used across the market.
Bottom Line
Gold indicators are most useful when they are grouped into a decision framework. Real yields and the dollar help with macro context. Central banks and ETF flows help with demand quality. Technical indicators help with timing and discipline.
No indicator removes uncertainty. The goal is to make your interpretation more structured, evidence-based, and less reactive.
FAQ: Gold Indicators
What are the most important gold indicators?
The most important gold indicators are real yields, the U.S. dollar, inflation expectations, central-bank demand, ETF flows, futures positioning, and price trend. Their importance changes with the market environment.
Do real yields always move gold prices?
No. Real yields are important because they affect gold’s opportunity cost, but they do not explain every move. Crisis demand, central-bank buying, and investor flows can offset or complicate the relationship.
Is gold always a good inflation hedge?
Gold can help preserve purchasing-power confidence over long periods, but it is not a perfect short-term inflation hedge. The response depends on real yields, currency moves, policy expectations, and demand conditions.
Are technical indicators enough for gold analysis?
Technical indicators are useful for reading trend and timing, but they are not enough on their own. They work better when combined with macro and demand indicators.
How often should gold indicators be checked?
Long-term investors may review key indicators monthly or quarterly. Traders may check them daily or weekly. The right frequency depends on time frame, position size, and risk tolerance.
Where can beginners learn more about gold exposure?
Beginners can start with the basics of how to invest in gold, then compare physical gold, ETFs, mining stocks, storage, premiums, and liquidity before making any decision.
 When you purchase a service or a product through our links, we sometimes earn a commission, at no extra cost to you.