
Understand how real yields, currencies, investment flows and physical demand affect gold, with worked examples, source checks and a demand chart.
- Distinguish wholesale gold from the premium on a coin or bar.
- Understand how rates, currencies and different buyers interact.
- Check dates and definitions before trusting a demand statistic.
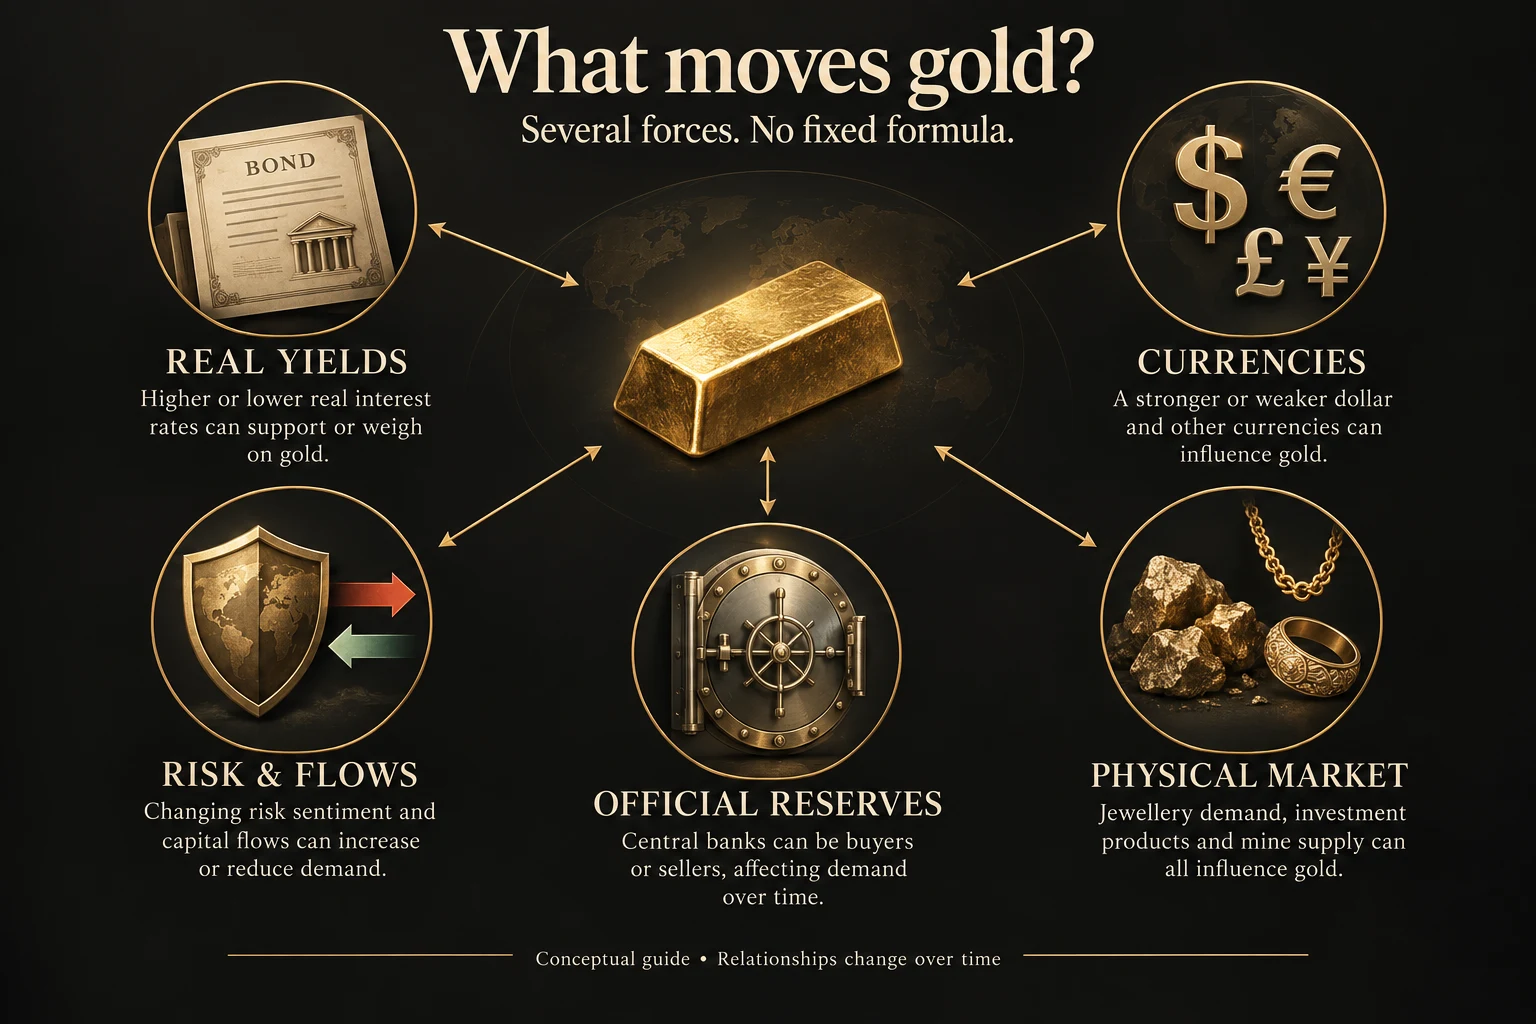
Understanding gold starts with a question more useful than “Which factor matters most?”: What changed, for which participants, over which period? A bond-market repricing can happen in minutes, while changes in mine output take much longer.
This guide explains the underlying mechanisms in both directions. To investigate a particular rally, use the companion guide to why gold prices rise and how to check the evidence.
- Gold produces no interest, making competing yields relevant to its appeal.
- A dollar quote and your home-currency return are different measurements.
- Investment and consumer demand can move in opposite directions.
- Existing holdings, recycling and trading matter alongside newly mined gold.
First, which gold price are you looking at?
A financial headline, a benchmark auction and a dealer’s checkout page do not necessarily show the same price. Comparing them without matching the time, currency and product can make an ordinary difference look like a market anomaly.
| Price layer | What it represents | What to check |
|---|---|---|
| Spot quote | A current wholesale-market indication for gold. | Timestamp, currency, bid or ask, and provider. |
| LBMA Gold Price | An auction-based reference price at scheduled times. | AM or PM benchmark and the relevant business day. |
| Retail bullion price | The price of a specific coin or bar, including its premium. | Fine-gold weight, fabrication, availability, fees and delivery. |
| Dealer buyback bid | What a dealer offers to pay you. | Spread, product condition and any verification charges. |
The Royal Canadian Mint distinguishes benchmark, spot and dealer costs. For the reference-price series, consult LBMA’s precious-metal prices; an auction reference is not a promise that a small retail purchase will transact at that level.
A local shortage of a popular coin can raise its premium even if wholesale gold is flat. Our spot-to-buyback guide explains how to compare the complete transaction.
Real yields: the income you give up
A gold bar pays no coupon. Higher inflation-adjusted yields on relatively safe bonds can make holding gold less attractive; lower real yields can reduce that opportunity cost.
“Real” means adjusted for inflation, but the measurement matters. Subtracting expected inflation from a nominal yield is a useful approximation; subtracting last month’s inflation rate does not produce the same forward-looking measure.
If a one-year nominal return is 5% and expected inflation is 3%, the exact inflation-adjusted return is 1.05 ÷ 1.03 − 1 = 1.94%. The simple subtraction gives approximately 2%.
If the nominal return falls to 4% with inflation expectations unchanged, the exact figure falls to 0.97%. This changes the comparison with gold; it does not calculate gold’s next return.
The 10-year Treasury inflation-indexed yield series on FRED is one observable market measure. It is a long-maturity yield, not a savings-account rate or the Federal Reserve’s overnight policy target.
The Chicago Fed’s research examines real rates, inflation expectations and economic pessimism together. That is a useful safeguard against attributing every movement to one interest-rate announcement.
Currencies: translation and demand are separate channels
Gold is widely quoted in US dollars, but people buy it using many currencies. If the dollar gold price stays unchanged while your currency weakens against the dollar, the local-currency price rises mechanically.
Currency movements can also change affordability and investment preferences. That economic response is separate from the arithmetic conversion, and other demand changes can outweigh it.
For broad currency context, the Federal Reserve’s trade-weighted dollar index measures the dollar against a basket. It should not be substituted directly for the particular exchange rate needed to calculate a euro or sterling purchase.
Use the same dates and quote convention throughout a comparison. Our live gold-price page provides a starting point for checking dollar and euro quotes.
Risk and investment flows: fast-changing demand
Investors may seek gold when confidence in other assets weakens. They can also sell it to raise cash, meet collateral requirements or reduce overall exposure, so a crisis is not an automatic one-way signal.
ETF creations and redemptions, futures positioning and over-the-counter transactions are different ways exposure changes. A trade in a futures contract is not the same event as a consumer buying a physical coin.
These channels can reinforce one another: a price move attracts attention, additional investors participate, and momentum extends the move. The process can reverse when participants reduce positions.
Investors seek additional gold exposure as alternatives become less attractive.
Investors sell holdings or unwind leveraged positions as conditions change.
Observed flows can follow prices as well as influence them; direction alone does not establish causality.
The WGC’s July 2026 commentary illustrates offsetting influences: positive momentum and other pressures left the monthly price broadly unchanged. Several active drivers do not necessarily produce a large net move.
Central banks: an important buyer, not a guaranteed floor
Official institutions hold gold as part of their reserve portfolios. Their decisions can reflect long-term diversification and reserve-management objectives rather than the same considerations as a jewelry shopper.
However, institutions differ in their needs and can buy, pause or sell. A report of net purchases does not identify a price below which all central banks will buy without limit.
Keep the detailed reserve rationale separate from short-term trading claims; see why central banks buy gold. For an episode-specific explanation, distinguish purchases made during a period from data published after that period.
Physical demand: why jewelry can weaken during a rally
Higher household income can support purchases, while a higher price can reduce the quantity buyers can afford. Jewelry demand also reflects local customs, seasonality and the cost of the finished product.
The World Gold Council’s market-structure primer describes gold’s consumer and investment roles. A change in one category does not tell you what happened across the entire market.
Annual gold demand, tonnes
Investment
Jewelry consumption
Shared scale: zero to 2,500 tonnes. Selected categories; investment excludes OTC.
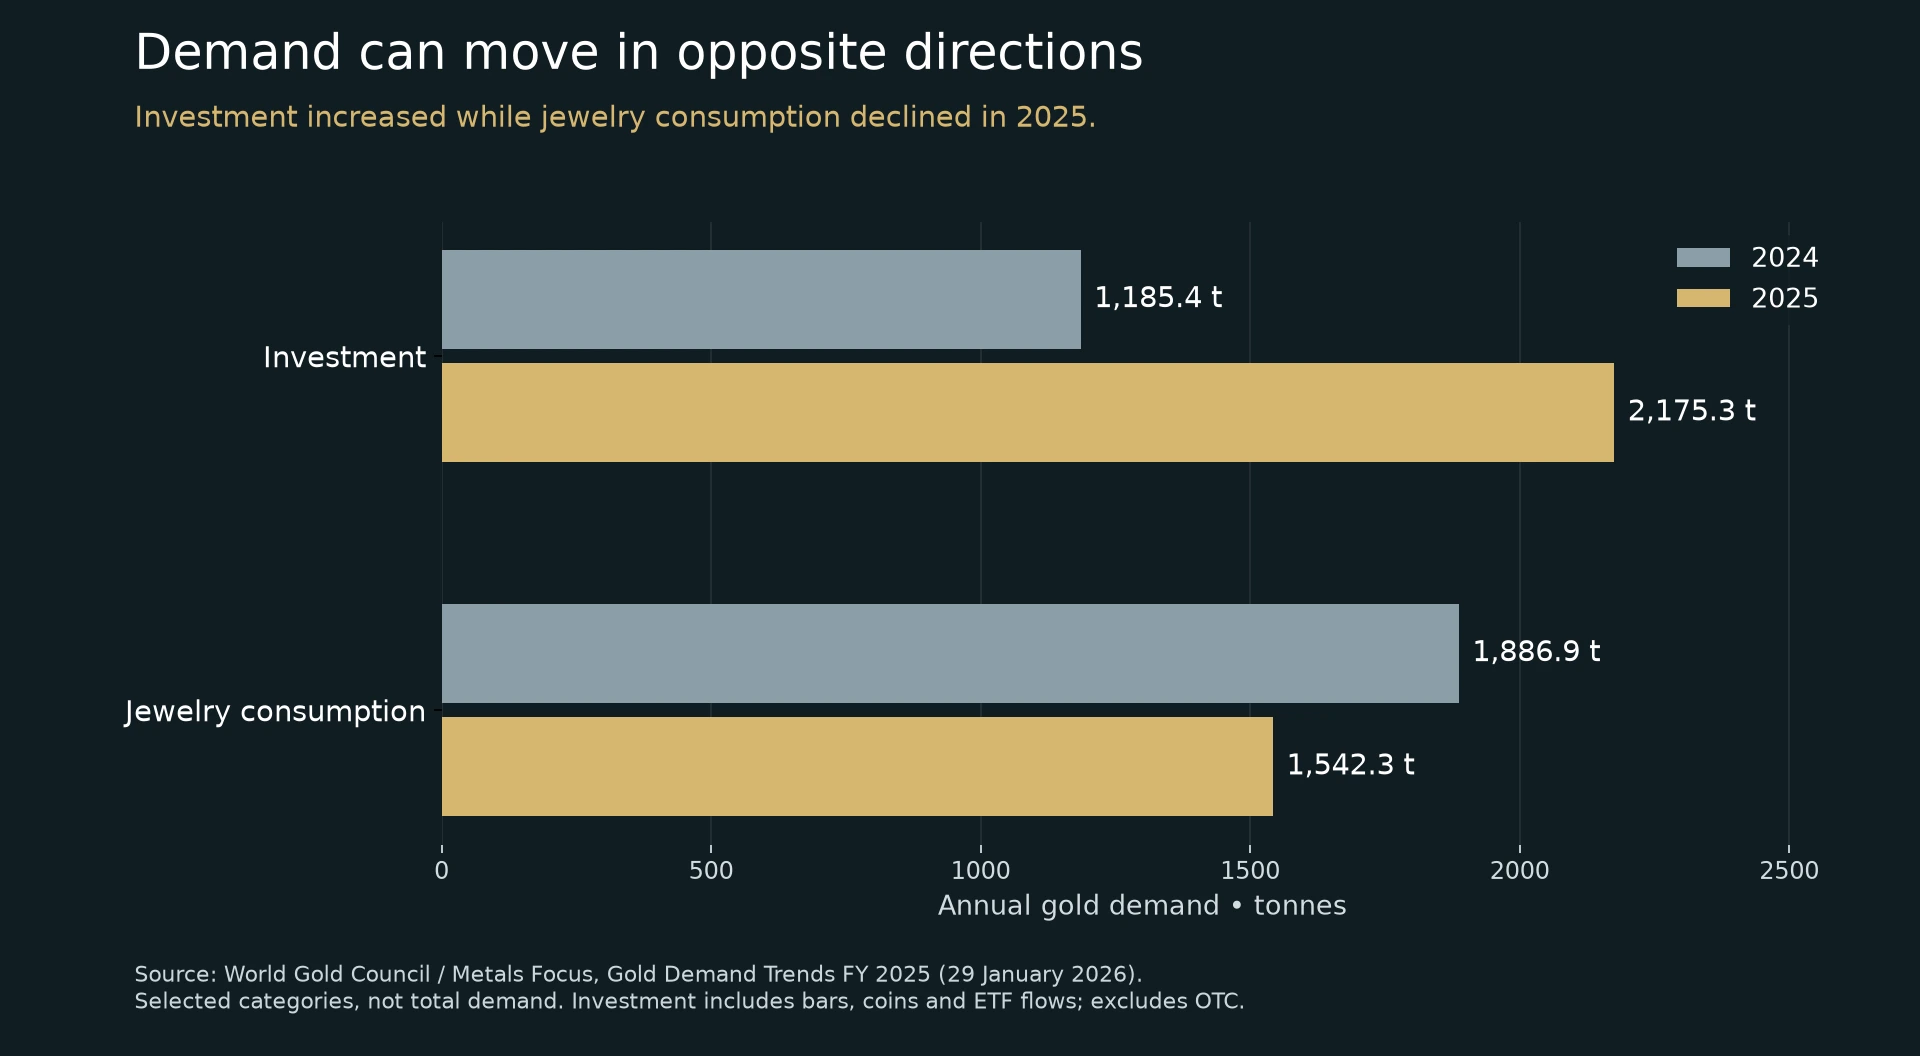
The comparison shows why “demand is strong” needs a category attached. It does not measure how many percentage points of the gold-price change each category caused.
Read the chart values and definitions
| Annual category | 2024 | 2025 |
|---|---|---|
| Investment | 1,185.4 t | 2,175.3 t |
| Jewelry consumption | 1,886.9 t | 1,542.3 t |
Investment includes bars, coins and ETF demand, excluding OTC. Jewelry consumption differs from fabrication because inventories can change; these selected categories do not add up to total demand.
Supply: existing stocks matter as well as new mines
Gold is held in bars, coins, jewelry and reserves accumulated over many years. Changes in willingness to hold or release existing metal help the market adjust without waiting for a new mine.
Mine development is a much slower process than financial trading. Recycling can respond more quickly, although owners do not all sell at the same price or for the same reason.
Producer hedging adds another distinction: a miner can lock in future selling prices without immediately producing additional ounces. A supply table should therefore be read using its definitions rather than treating every line as newly extracted gold.
In its 2025 supply discussion, the WGC separately reports mine production, net producer hedging and recycling. Those categories answer different questions.
How gold price factors can pull in opposite directions
| Situation | Potential support | Potential pressure |
|---|---|---|
| Inflation rises | Concern about purchasing power. | Higher real yields if policy expectations tighten enough. |
| Economic growth improves | Household spending and consumer demand. | Less defensive demand or more attractive competing assets. |
| A geopolitical shock occurs | Demand for hedges and reserves. | Cash needs, leveraged selling or a stronger dollar. |
| The gold price rises sharply | Momentum and additional investment interest. | Profit-taking, recycling and reduced jewelry affordability. |
These are possible mechanisms, not trading rules. A useful explanation identifies which effects were observable in the chosen period instead of assigning a permanent ranking.
A practical check before drawing a conclusion
- Name the price: spot, benchmark, retail ask or buyback bid.
- Match the period: avoid comparing a daily move with a full year’s demand total.
- Check definitions: real versus nominal yields, dollar versus local currency, volume versus value.
- Look for opposing evidence: identify which observations do not fit the proposed explanation.
- Separate explanation from action: a plausible cause does not tell you the next price or an appropriate purchase size.
For longer comparisons, use gold-price history and the inflation-adjusted gold calculator. A nominal record alone does not establish a purchasing-power record.
Watch: how different forces affect gold
This explainer provides historical context for demand, rates and market shocks. Its examples are background education rather than a current-price forecast.
FAQ: Gold Price Factors
What is the most important gold price factor?
There is no permanent winner. The relevant question is which changes affected demand and supply over your chosen period, and what evidence supports that interpretation.
Does inflation always increase gold’s price?
No. Inflation, policy responses, real yields and currency movements interact, and a headline inflation rate does not determine gold’s return.
Can gold rise when real yields rise?
Yes. Other demand or risk changes can outweigh the opportunity-cost channel, so the relationship should be tested rather than assumed.
Why does a gold coin cost more than spot?
It is a manufactured, distributed product with its own availability and dealing costs. Check the premium and fees, and compare the dealer’s buyback terms.
Do more tonnes of demand prove what caused a rally?
No. Category totals describe activity using specific definitions and reporting periods; they do not isolate causal contributions to a price movement.
This is educational market information, not personalized investment advice. Gold can fall substantially, produces no income and incurs ownership or dealing costs.
 When you purchase a service or a product through our links, we sometimes earn a commission, at no extra cost to you.